The Hamscalper Suite
Swipe through the suite of indicators designed to enhance your trading experience.
The Ultimate Hamscalper: Your Edge in Trading
The Ultimate Hamscalper is a trend-following indicator designed to make trading decisions clearer and more efficient. Built from real-world trading needs, this tool combines multiple features into one powerful package, helping traders spot opportunities and manage risk with ease.
Clear Bullish and Bearish Trend Signals
The Ultimate Hamscalper provides color-coded arrows for potential bullish trends (green) and bearish trends (red), giving you instant clarity on market trends. Each signal also generates two stop-loss levels (risk-off and risk-on) and three take-profit targets to help you plan your trades confidently.
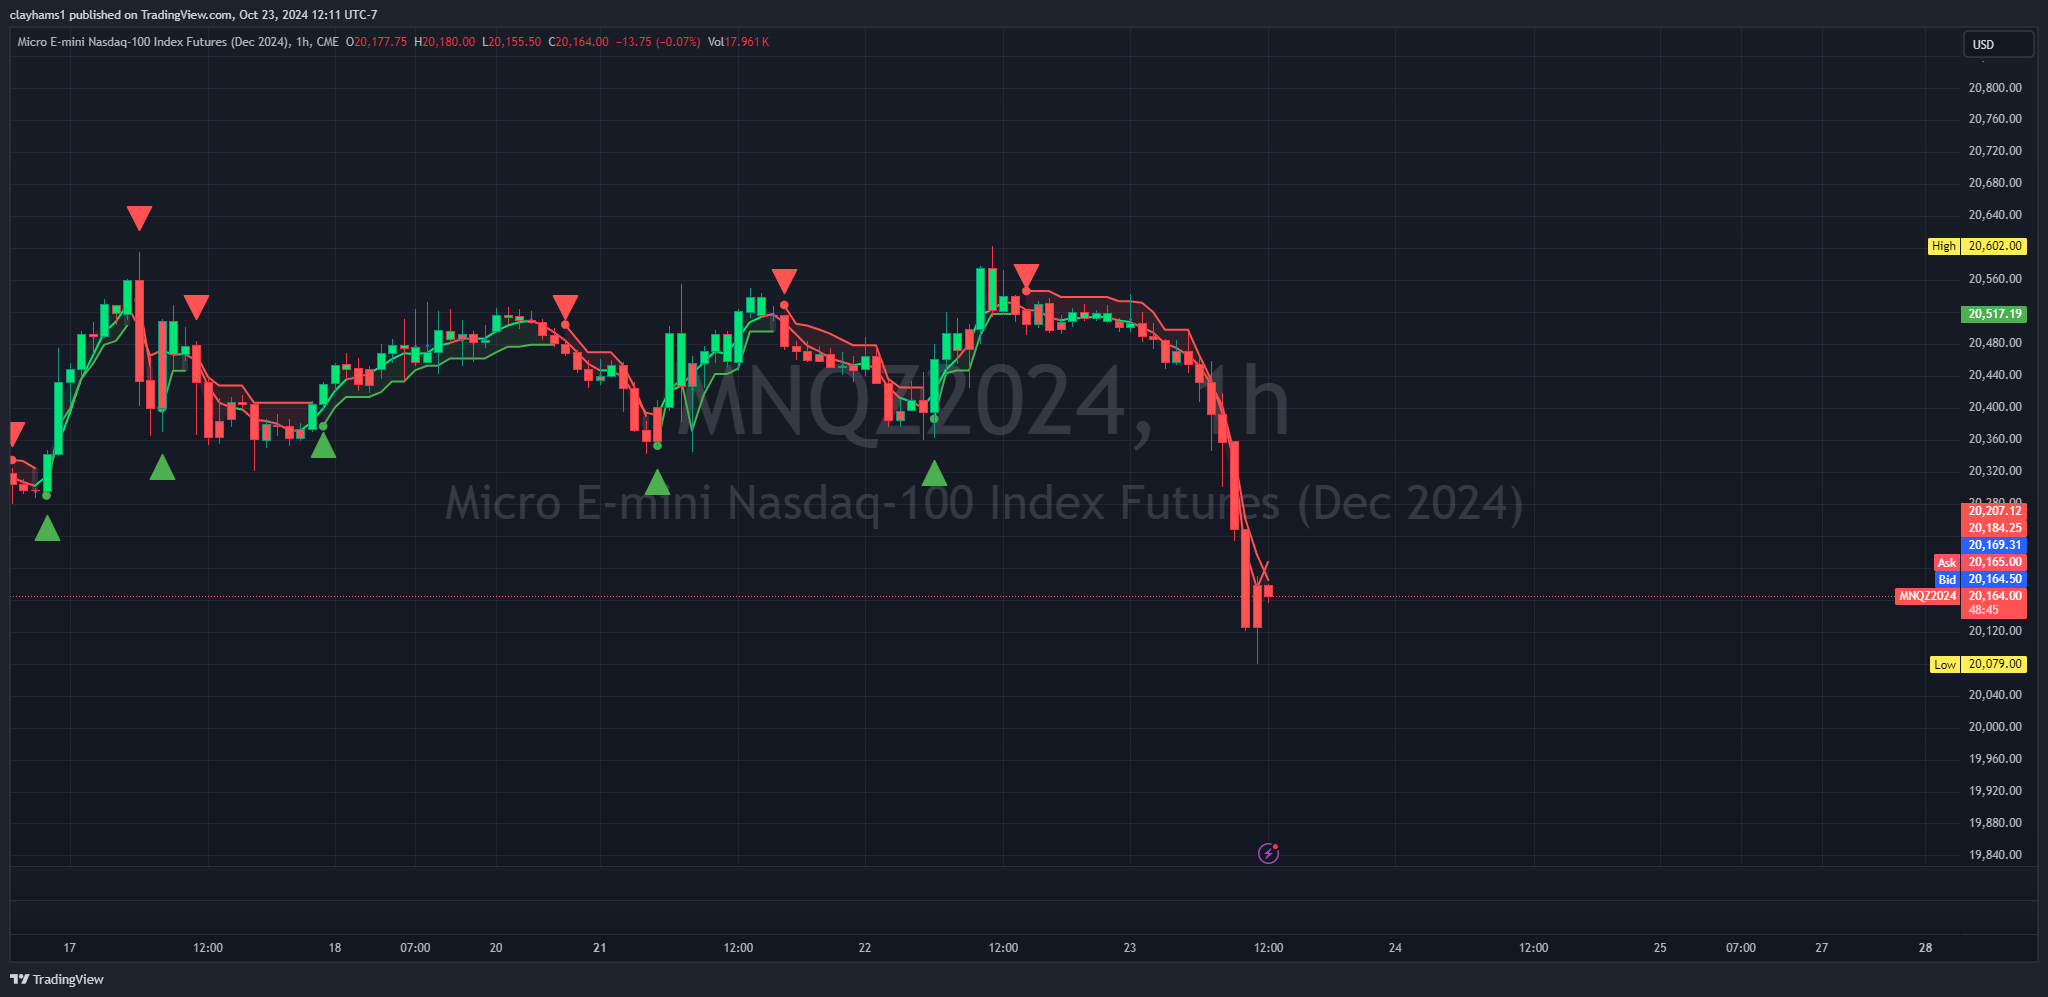
Only Trend Signals On.
Advanced Features for Better Trading
- Auto Fibonacci Levels: Automatically plots six commonly used Fibonacci levels to identify key price zones. This feature can be toggled on or off for flexibility, with levels color-coded for easy visualization.
- Customizable Trend Cloud: The cloud feature helps you visualize market trends by generating a trend cloud based on EMAs of your choice. Toggle it on to get a broader perspective or off for a cleaner chart.
- Auto VWAP Plotting: VWAPs are automatically plotted using my personal settings, providing a reliable gauge of price action strength. This feature can also be toggled on or off as needed.
- Color-Coded Bars: The bars on your chart change color to reflect the current signal—green for long positions and red for shorts—giving you a quick visual guide without any guesswork.
Built for Traders, by a Trader
The Ultimate Hamscalper is based entirely on the strategies I’ve used personally, designed to be visually intuitive and efficient. Whether you prefer Heikin Ashi candles or standard candles, the indicator’s visual prompts guide you without overwhelming your chart.
Versatile Across Markets and Timeframes
Originally designed for scalping, The Ultimate Hamscalper works seamlessly across Crypto, Stocks, Forex, and Futures. It's versatile enough to support multiple trading styles—from scalping to swing trading—on timeframes such as 6m, 9m, and 18m. Or, use higher timeframes like 1Hr, 4Hr, or 1D for anticipating the larger trend overall.
Why Choose The Ultimate Hamscalper?
- Simplicity: All signals and levels are clearly color-coded, making it easy to trade even in fast-paced environments.
- Flexibility: Fully customizable settings allow traders to tailor the tool to their strategies.
- Confidence: Provides key decision points—entries, exits, and risk levels—so you can trade with greater confidence.
Join Countless Traders
Join countless other traders who are simplifying their journey with The Ultimate Hamscalper. Get the clarity and tools you need to make better trading decisions.
Ready to Run with the Pigs?
Ready to automate your trading? Start with HamBot today and take your trading to the next level.
Disclaimer: All indicators and tools provided by Oink Opulence Endeavors LLC are for educational and informational purposes only. Trading involves significant risk of loss and is not suitable for all investors. None of the indicators or tools provided constitute financial advice, and no specific results are guaranteed. Oink Opulence Endeavors LLC carries zero responsibility for any losses incurred through the use of any of its indicators, tools, or strategies. Always conduct thorough research and consult a licensed financial professional before making any trading decisions. Use these tools at your own risk.
Hambones Trend Reader: Master Market Trends with Confidence
Hambones Trend Reader is an advanced EMA and algorithm-based indicator that combines the power of exponential moving averages with sophisticated analysis of past candle patterns to help you master market trends. Whether you're a scalper looking for quick moves or a long-term trader, this tool has the versatility to meet your needs, adapting seamlessly across different timeframes and market types, including Futures, Stocks, Crypto, and Forex.
Four Powerful Trend Settings
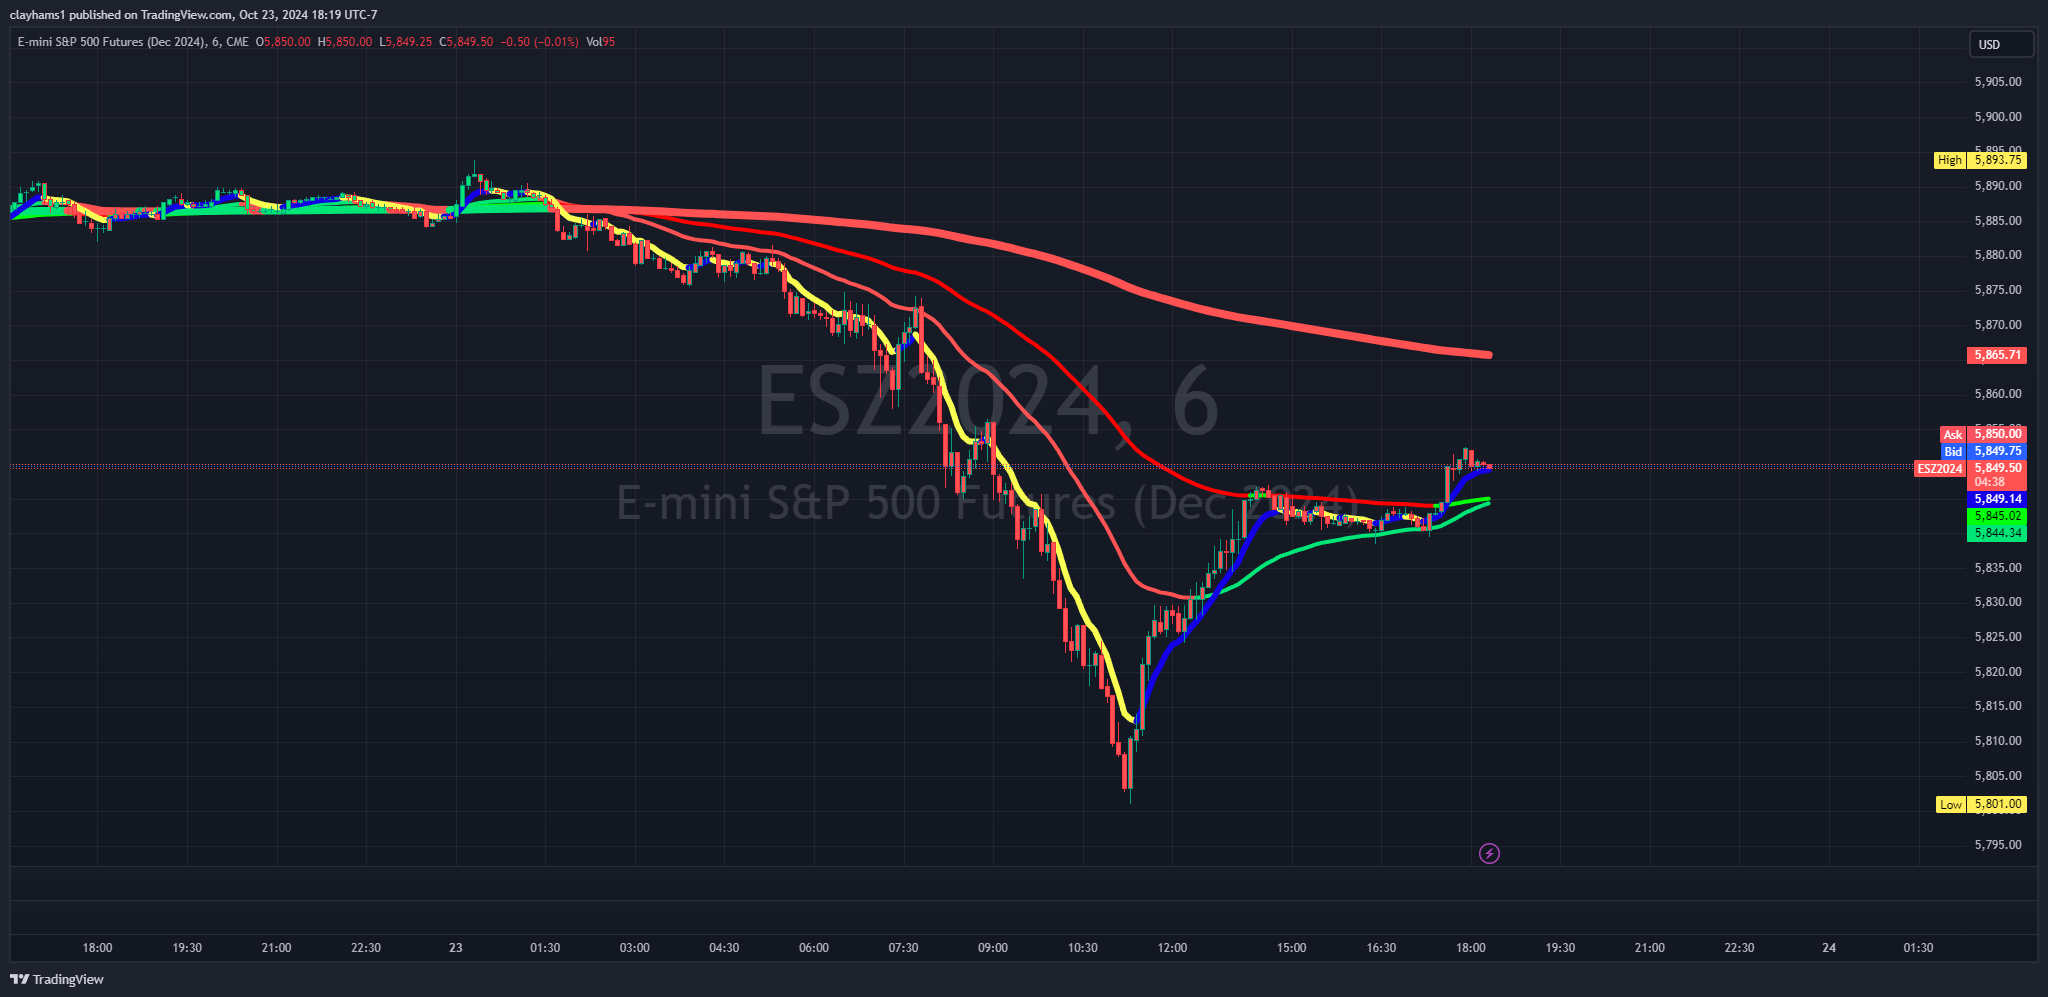
Scalping Trend
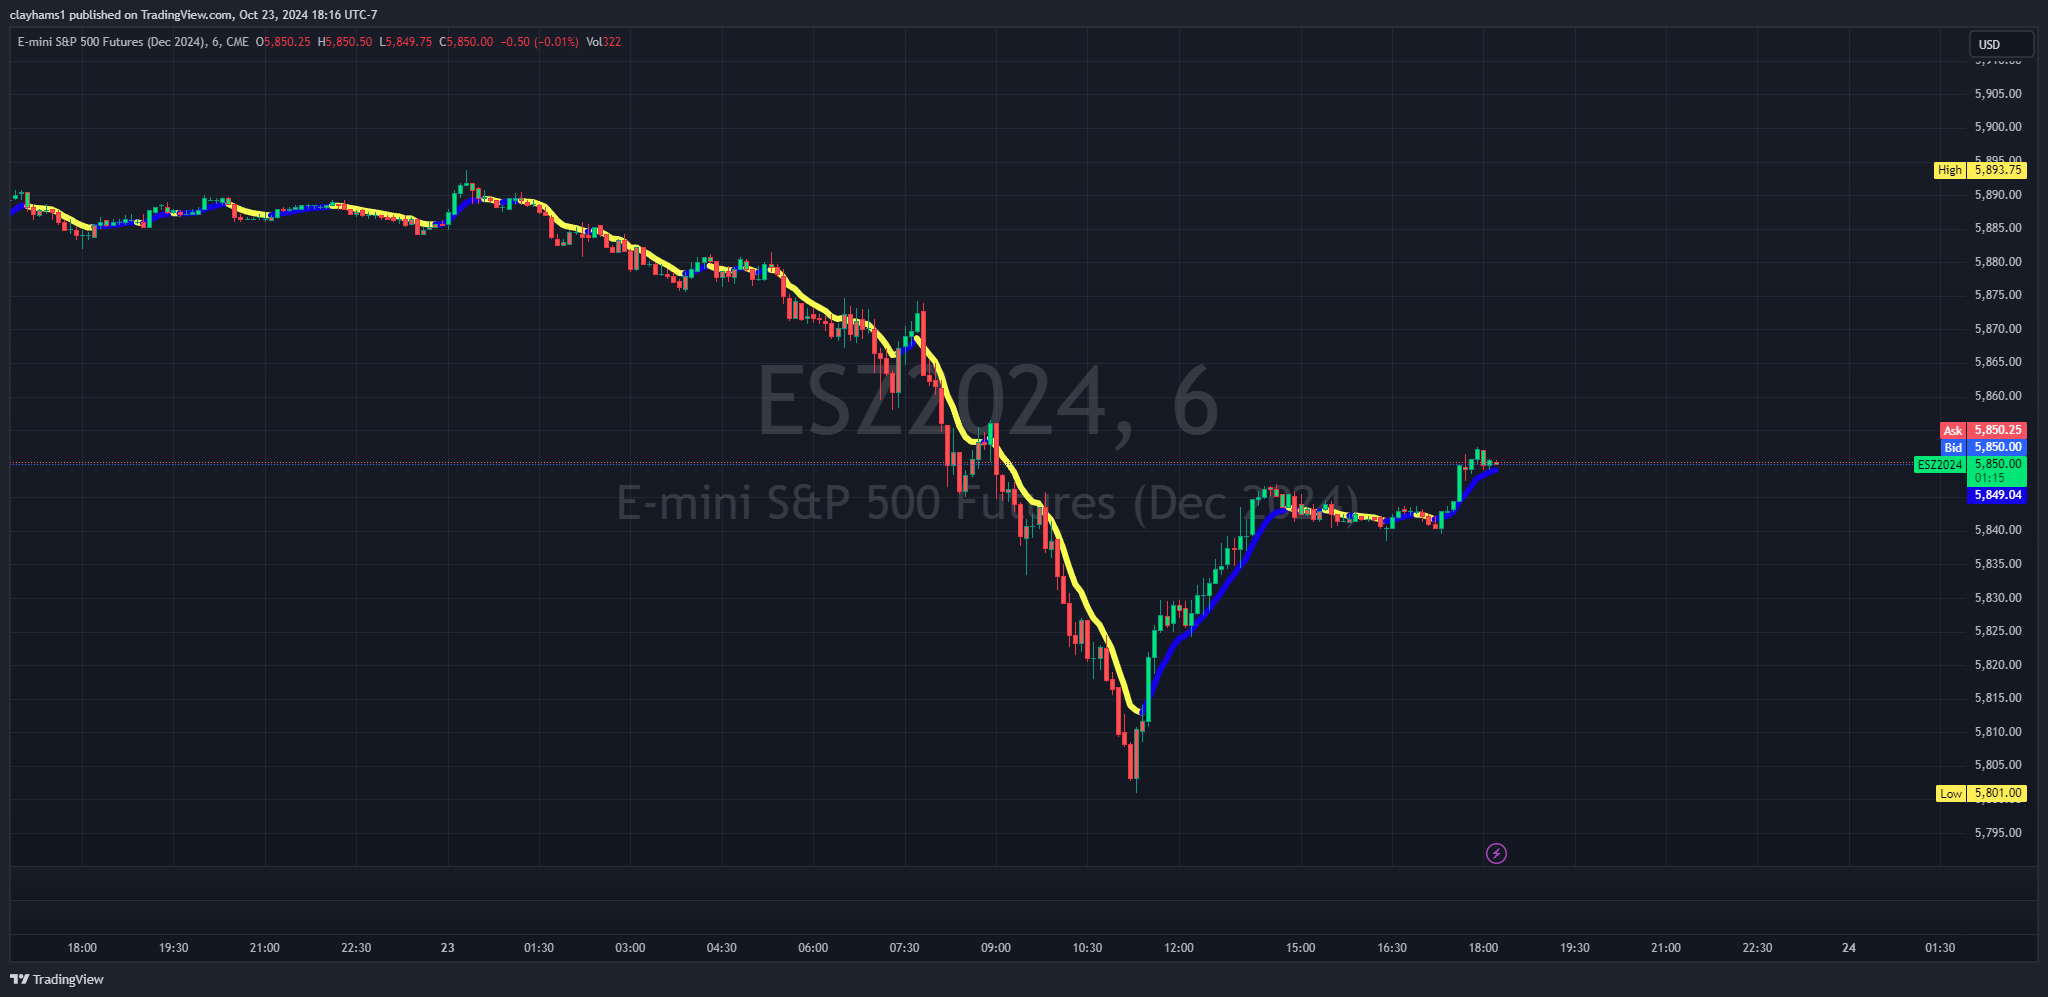
Designed for traders seeking quick moves, the scalping setting uses yellow and blue to indicate short and long opportunities, respectively. Yellow signals a short trend, while blue signals a long trend. You can easily toggle the bar color to reflect the scalping trend, allowing for instant clarity during fast-paced trading sessions.
Short Term Trend Reader
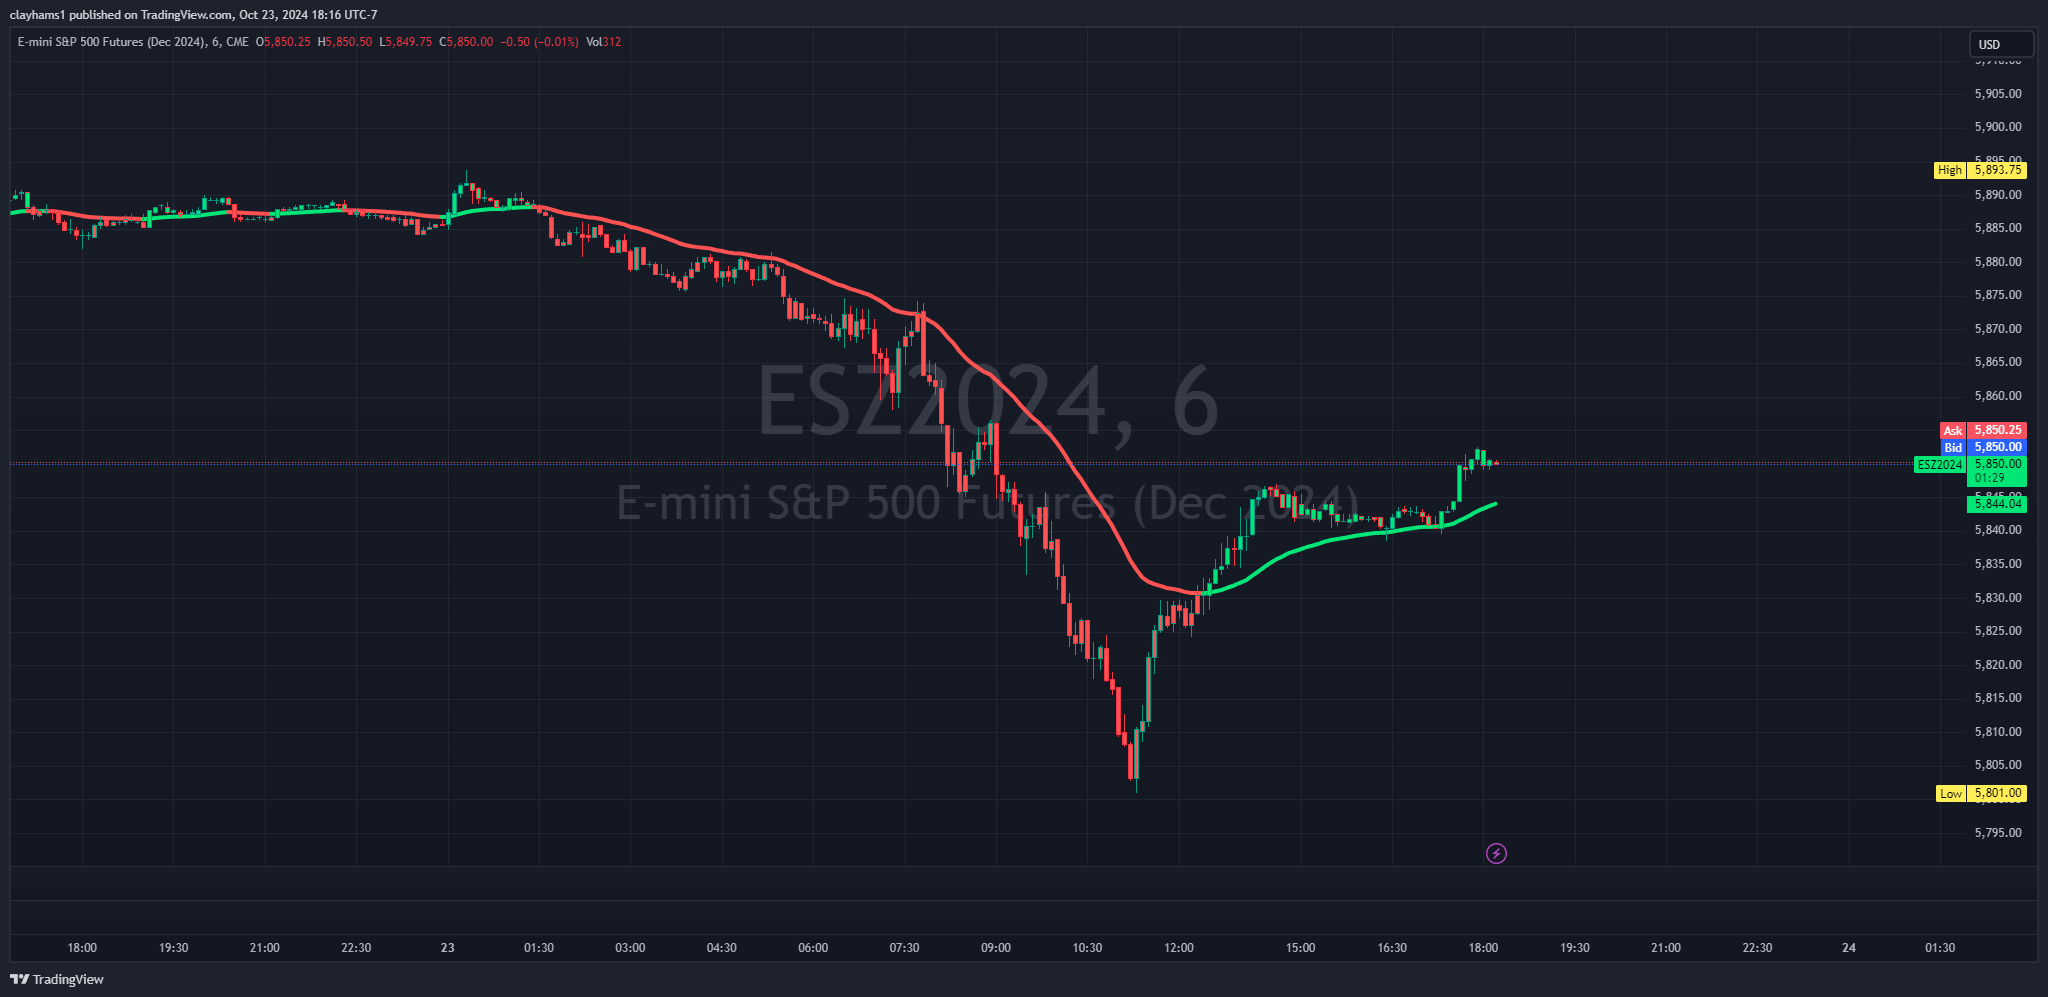
Perfect for intraday moves, the short-term trend reader helps capture trends that may last up to a full day. When the price breaks above, the trend is indicated in green; when it breaks below, the trend turns red. This feature can be set to change the bar color to match the current trend, giving you an easy visual cue to stay aligned with intraday market moves.
Medium Term Trend Reader
Similar to the short-term trend reader but tuned to higher EMAs, the medium-term trend setting is perfect for traders looking to stay in trades a bit longer. It provides more stability, allowing you to capture more extended price movements and potentially maximize gains. This setting also allows toggling the bar color to visually represent the trend.
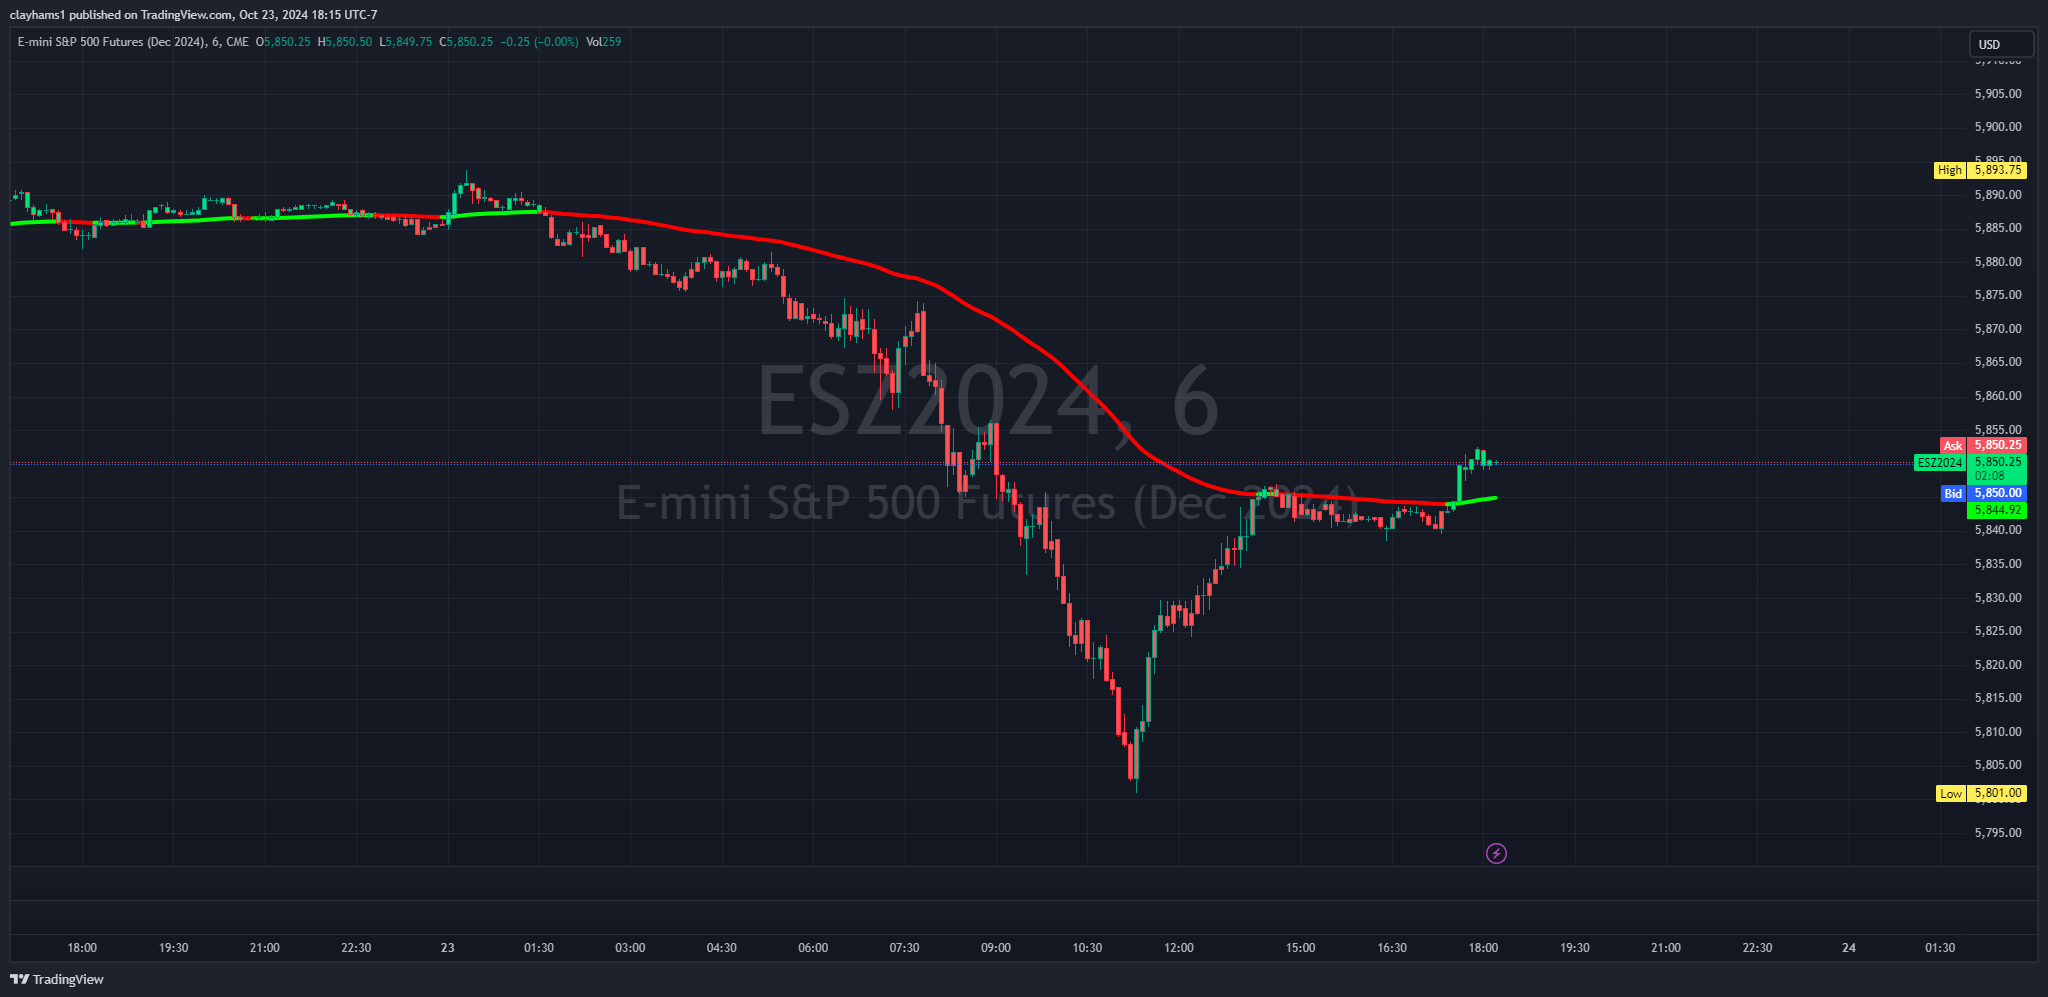
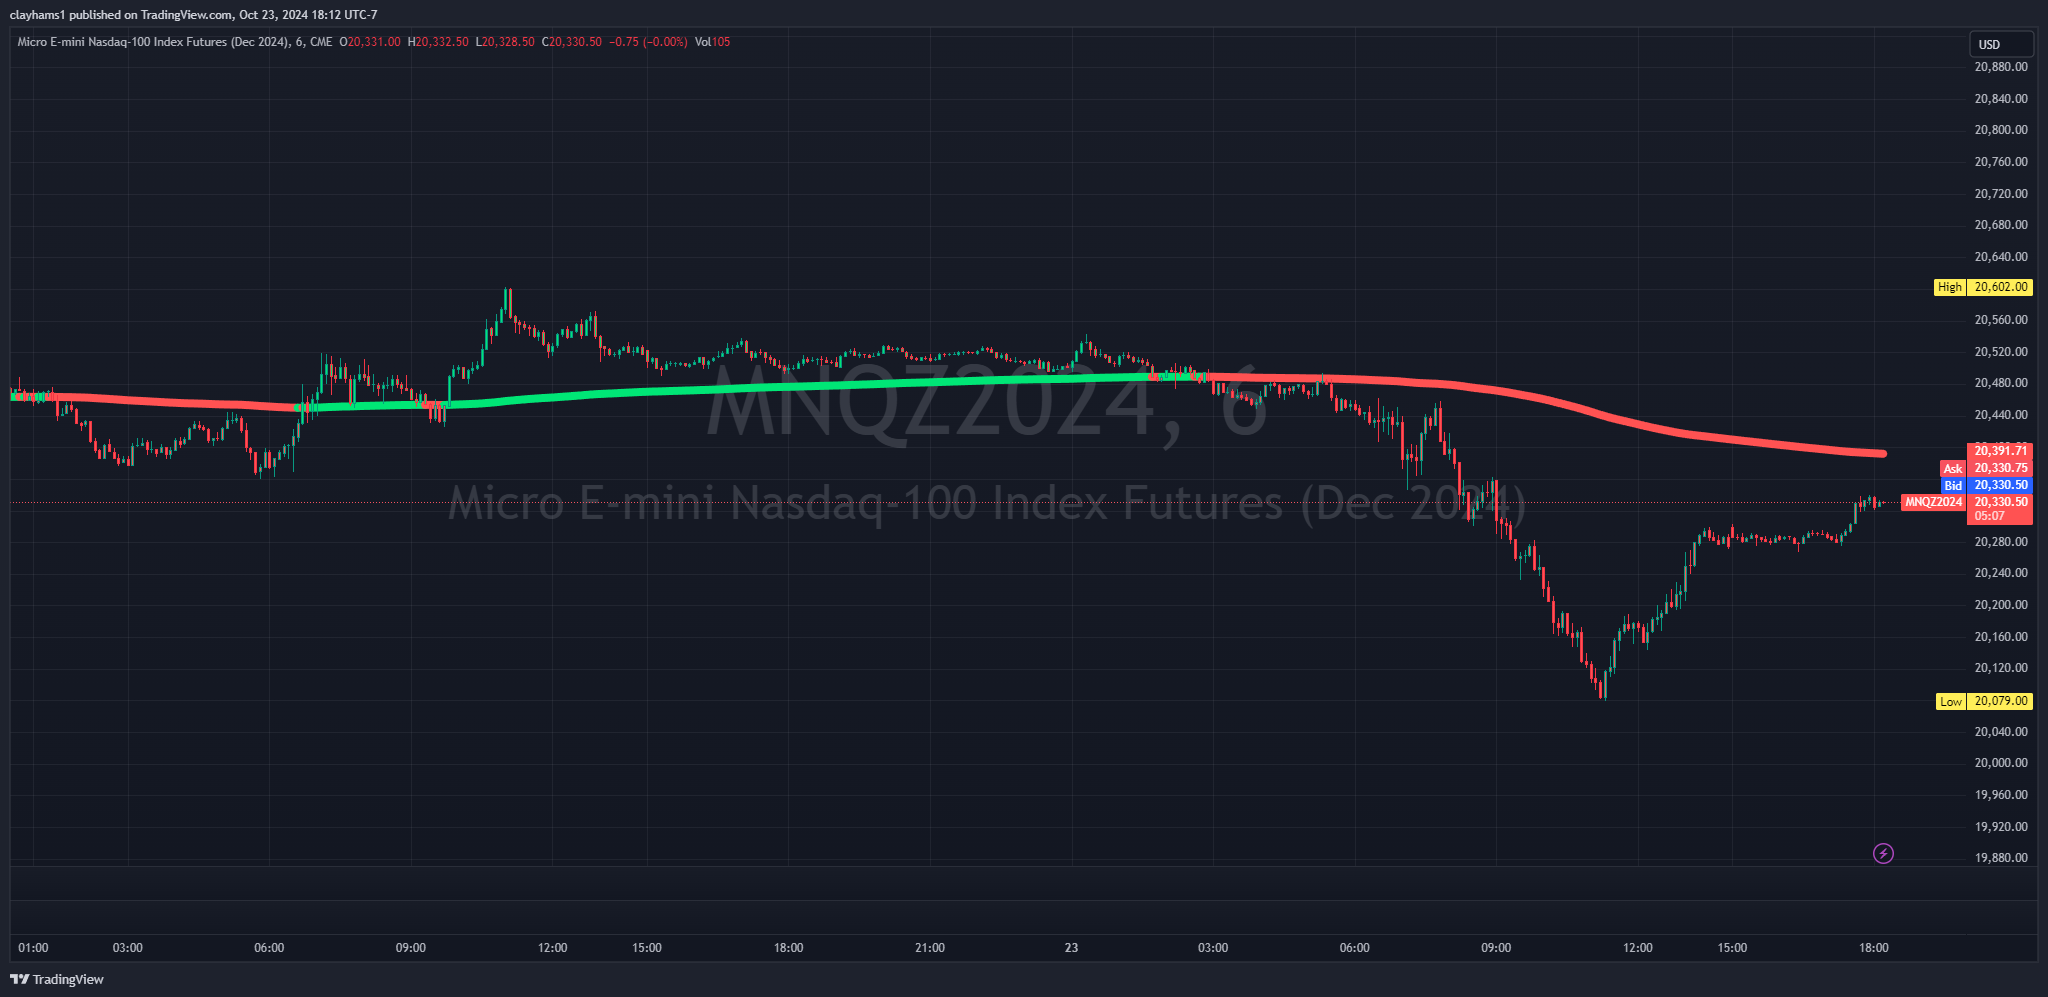
Long Term Trend Reader
The Long Term Trend Reader is the crown jewel of this indicator. Based on even higher EMA levels, it provides essential insights into larger market trends. On lower timeframes (e.g., 5m, 6m, 9m, 18m), it acts as dynamic support and resistance, making it easier to predict bounces and rejections. On higher timeframes (e.g., 4hr, 6hr, 8hr, 1d, 1w), it offers highly reactive levels, often acting as crucial support or resistance, helping traders navigate major market movements with greater confidence.
Adaptable Across All Markets and Timeframes
Hambones Trend Reader automatically adjusts to any timeframe you're using, whether you're scalping quick moves or trading long-term trends. The reactive levels adapt accordingly, providing you with relevant insights regardless of the timeframe or asset class—be it Futures, Stocks, Crypto, or Forex.
Why Choose Hambones Trend Reader?
- Comprehensive Trend Analysis: Covers all trading horizons—scalping, short-term, medium-term, and long-term—with settings tailored to each style.
- Customizable Visualization: Color-coded trend bars and easily toggleable features make it user-friendly and customizable to fit your preferences.
- Versatile Usage: Works seamlessly across all markets and timeframes, providing essential insights to help you make informed trading decisions.
Ready to Master Market Trends?
Ready to automate your trading? Start with HamBot today and take your trading to the next level.
Disclaimer: All indicators and tools provided by Oink Opulence Endeavors LLC are for educational and informational purposes only. Trading involves significant risk of loss and is not suitable for all investors. None of the indicators or tools provided constitute financial advice, and no specific results are guaranteed. Oink Opulence Endeavors LLC carries zero responsibility for any losses incurred through the use of any of its indicators, tools, or strategies. Always conduct thorough research and consult a licensed financial professional before making any trading decisions. Use these tools at your own risk.
Hambones Auto Support & Resistance: Effortlessly Identify Key Price Levels
Hambones Auto Support & Resistance is part of the comprehensive Hambone Suite of Indicators, automatically identifying and plotting potential support and resistance levels to help you navigate the market with ease. Originally designed for scalping, this tool works across all trading styles, from short-term intraday trading to long-term analysis, on any market—be it Futures, Forex, Crypto, or Stocks.
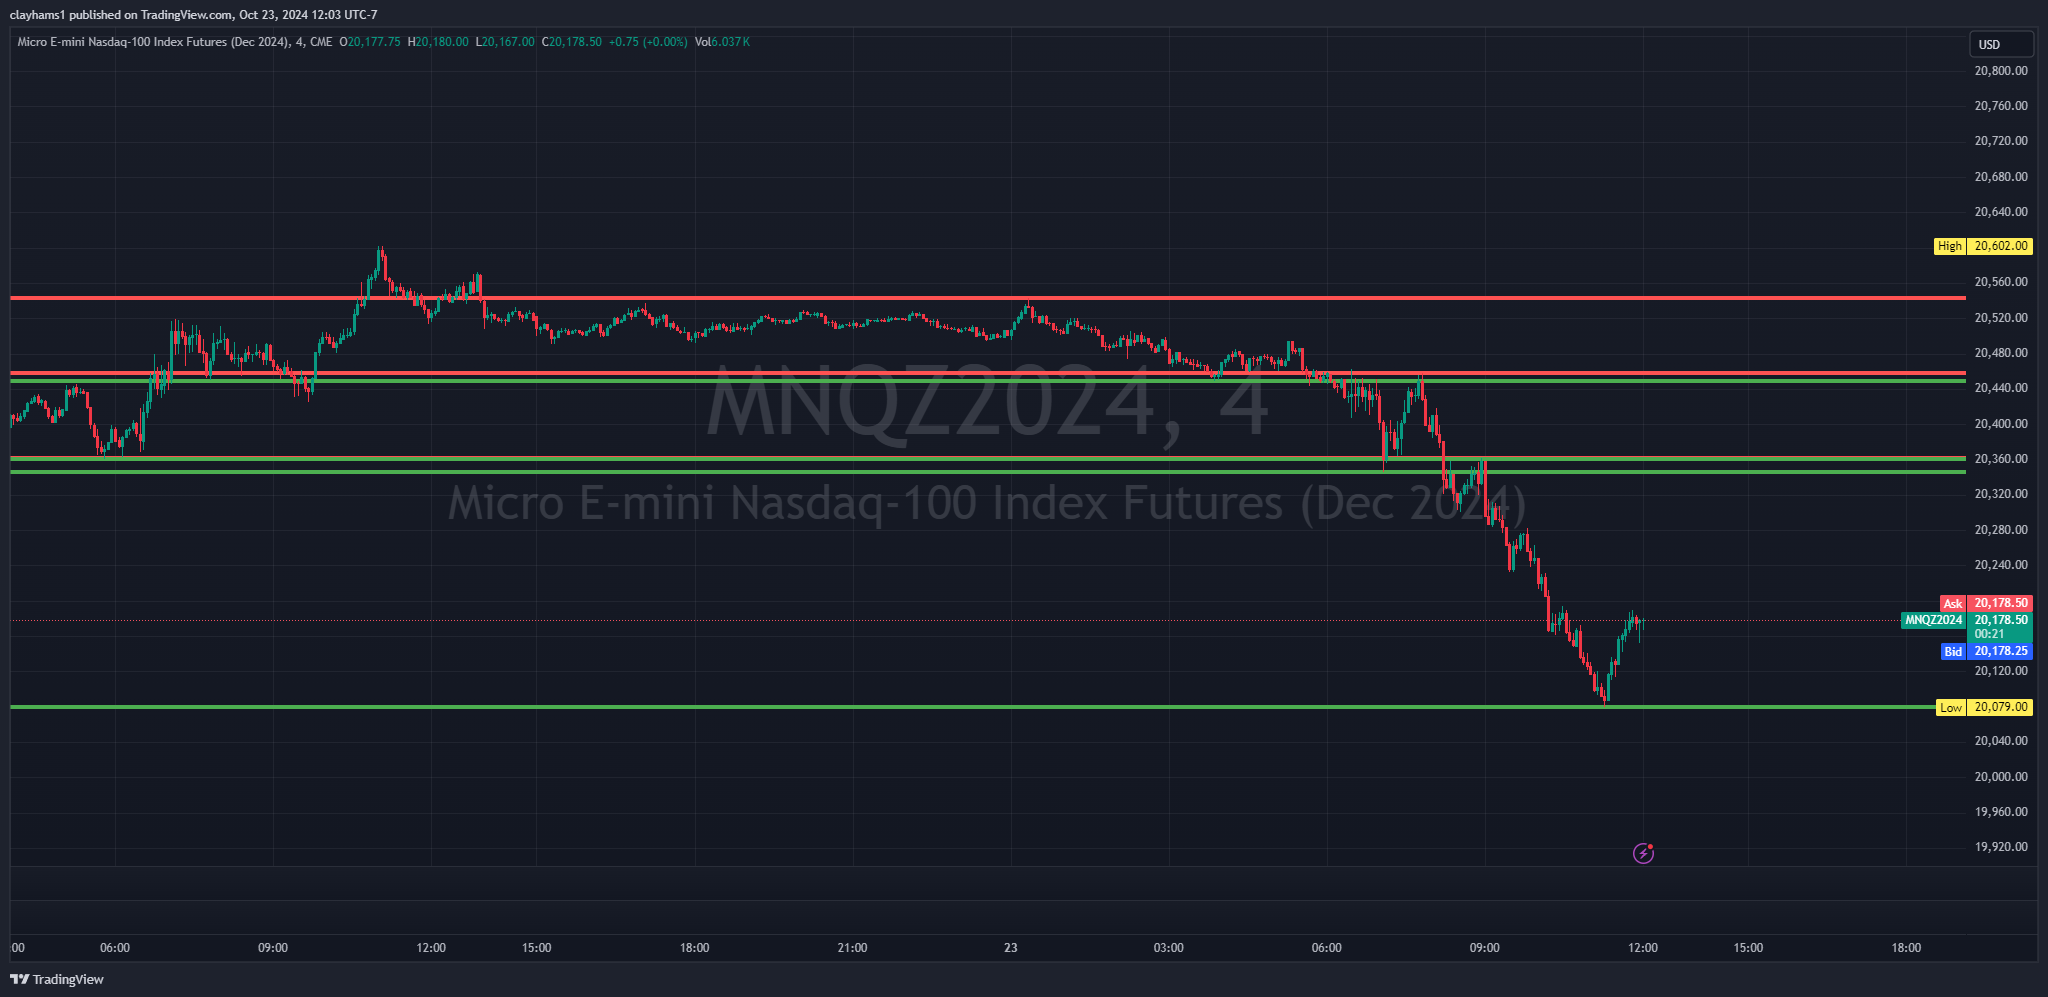
Dynamic Support & Resistance Levels
Hambones Auto Support & Resistance updates levels every few bars, adapting to the changing dynamics of the market. The support lines are marked in green, while resistance lines are marked in red, making it easy to identify these critical price levels at a glance. Due to the automated nature of this tool, new lines may occasionally appear above or below the current price unexpectedly, offering additional opportunities for interpretation.
Support and Resistance Versatility: Support lines can act as resistance and vice versa, depending on the market's movement. This adaptability allows traders to make use of these levels regardless of price positioning.
Tailored to Every Timeframe and Market
This indicator adapts uniquely to the timeframe you're using, automatically plotting relevant support and resistance levels based on the market's behavior on that specific timeframe. Whether you're trading on a 1-minute chart or a daily chart, Hambones Auto Support & Resistance ensures you're equipped with actionable price levels for effective trading decisions.
Scalping to Swing Trading
Originally developed for scalping, Hambones Auto Support & Resistance can also be used for swing trading or marking out significant levels on higher timeframes to execute trades on lower timeframes. It provides traders with valuable insights across all trading styles and approaches.
Why Choose Hambones Auto Support & Resistance?
- Always Updated Levels: Automatically plots the next anticipated support and resistance levels, ensuring you stay ahead of the market.
- User-Friendly Customization: Easily toggle support and resistance lines on or off to keep your chart clean when needed.
- Versatile Use Across Markets: Works with any market—Futures, Stocks, Crypto, Forex—providing consistent support and resistance levels, no matter where you trade.
Let’s Get Dynamic!
Ready to automate your trading? Start with HamBot today and take your trading to the next level.
Disclaimer: All indicators and tools provided by Oink Opulence Endeavors LLC are for educational and informational purposes only. Trading involves significant risk of loss and is not suitable for all investors. None of the indicators or tools provided constitute financial advice, and no specific results are guaranteed. Oink Opulence Endeavors LLC carries zero responsibility for any losses incurred through the use of any of its indicators, tools, or strategies. Always conduct thorough research and consult a licensed financial professional before making any trading decisions. Use these tools at your own risk.
Hambone's Abnormal Volume: Detect Unusual Activity with Precision
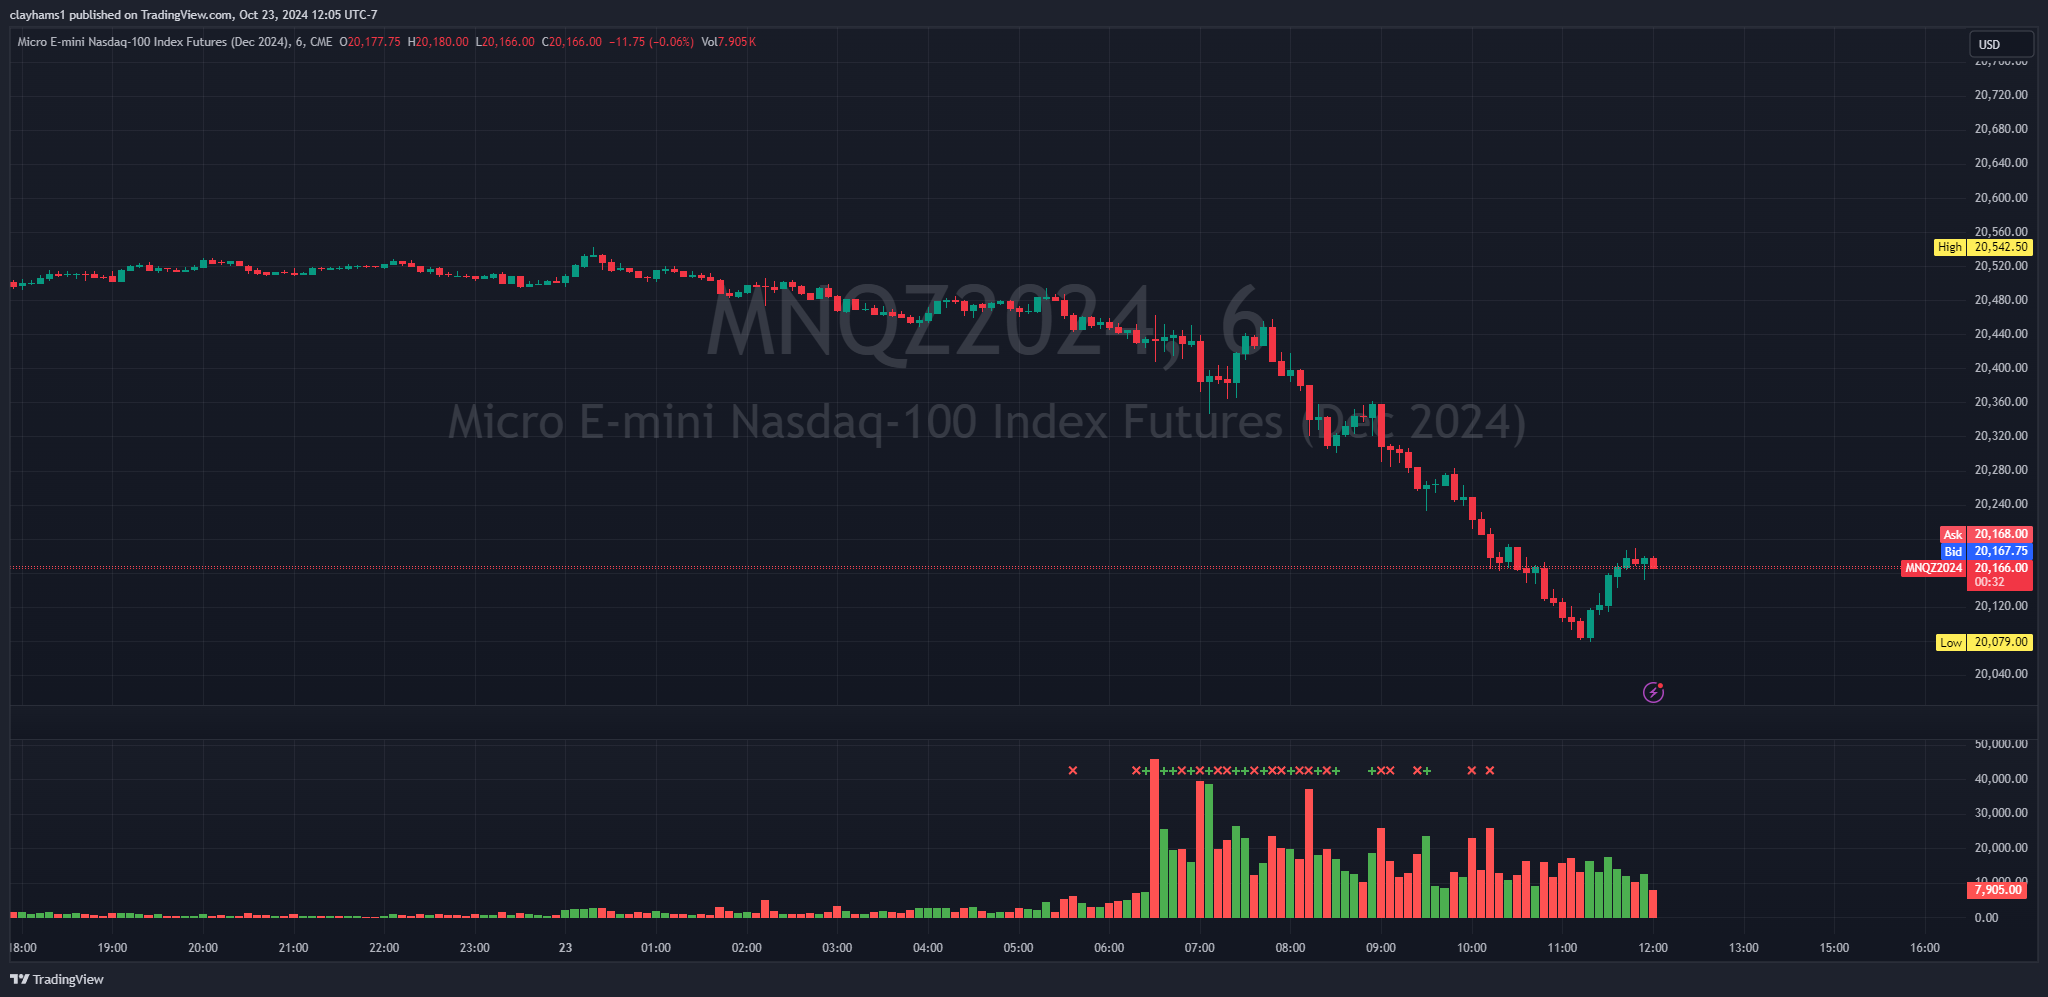
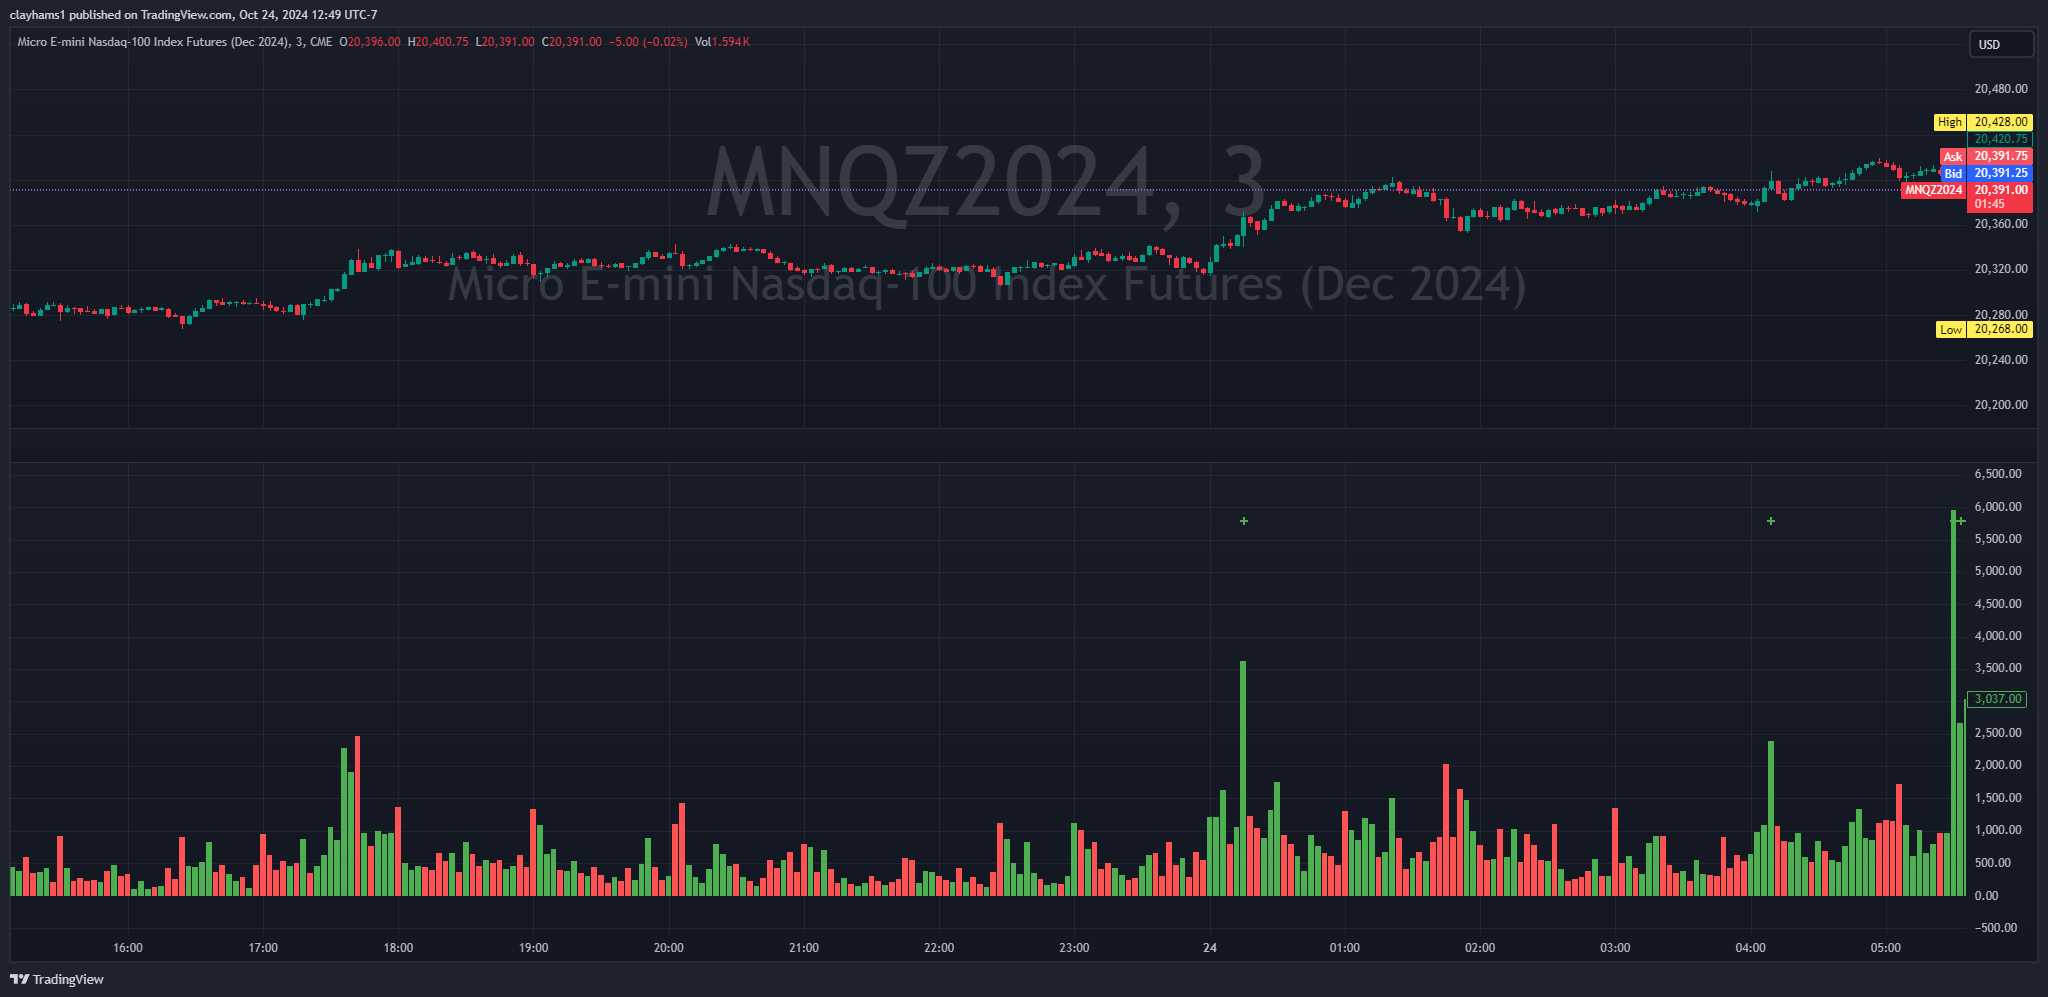
Hambone's Abnormal Volume is a specialized tool designed to identify abnormal trading volume during non-peak trading sessions. Originally built for personal use, this volume indicator focuses on detecting significant volume spikes during the London, Tokyo, and Sydney sessions, where futures volume is typically much lower compared to the New York session. This makes it a valuable tool for traders looking to spot unusual market activity in times of lower liquidity.
Spot Abnormal Volume with Ease
Hambone's Abnormal Volume is designed to catch volume anomalies that exceed the standard deviation of volume during the London, Tokyo, and Sydney sessions. When abnormal volume is detected, a red or green X (or cross) is plotted above the bar, indicating a potential bearish or bullish volume spike on that candle. The volume bars also change color based on whether the volume is predominantly being interpreted as bid-side or ask-side volume, providing additional context to market activity.
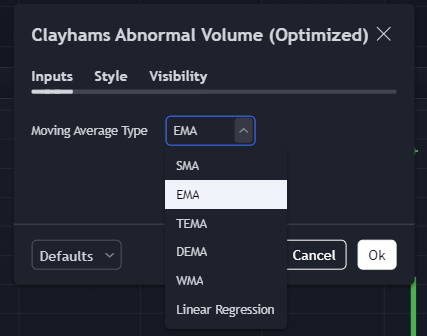
Customizable Volume Analysis
To provide flexibility in volume analysis, Hambone's Abnormal Volume allows users to choose from six different types of moving averages to fine-tune how volume data is calculated:
- Simple Moving Average (SMA)
- Exponential Moving Average (EMA)
- Triple Exponential Moving Average (TEMA)
- Double Exponential Moving Average (DEMA)
- Weighted Moving Average (WMA)
- Linear Regression Moving Average
This customization allows traders to adapt the indicator to their preferred style, giving them more control over the signals they receive.
Best Use Cases for Hambone's Abnormal Volume
- Non-Peak Sessions: Hambone's Abnormal Volume is best suited for detecting volume irregularities during non-peak sessions (London, Tokyo, Sydney), where market activity is generally quieter.
- Market Versatility: Ideal for trading Futures during non-New York sessions where volume tends to be lower, but also applicable to Crypto, Forex, and Stocks.
- Volume Analysis Flexibility: Customize the indicator with six different moving average types to adapt the volume analysis to your trading style.
Why Choose Hambone's Abnormal Volume?
- Focused on Abnormalities: Detect irregular volume spikes during sessions with typically lower liquidity.
- Customizable Moving Averages: Choose from six different moving average calculations for a tailored approach to volume analysis.
- Visual Alerts for Quick Analysis: Red and green visual markers make it easy to see abnormal volume spikes and understand the sentiment behind them.
- Seamless Integration with Hambone Suite: Part of the complete Hambone Suite of Indicators, providing a comprehensive set of tools for market analysis.
Nothing Abnormal About This Pig!
Ready to automate your trading? Start with HamBot today and take your trading to the next level.
Disclaimer: All indicators and tools provided by Oink Opulence Endeavors LLC are for educational and informational purposes only. Trading involves significant risk of loss and is not suitable for all investors. None of the indicators or tools provided constitute financial advice, and no specific results are guaranteed. Oink Opulence Endeavors LLC carries zero responsibility for any losses incurred through the use of any of its indicators, tools, or strategies. Always conduct thorough research and consult a licensed financial professional before making any trading decisions. Use these tools at your own risk.
Hambone's Momentum Reader: Get a Clear Read on Market Momentum
Hambone's Momentum Reader is a powerful mixed momentum indicator combining the strengths of MACD and RSI to provide a comprehensive view of the market's current state. This tool evaluates both indicators and generates clear visual signals to help traders assess the trend direction at a glance. Hambone Momentum Reader is part of the complete Hambone Suite of Indicators, included with every purchase.
Dual Trend Visualization with Momentum Circles
Hambone's Momentum Reader generates two sets of circles—one across the top of the chart and another across the bottom—each offering a different perspective on market momentum:
- Locked-In Trend Circles (Top): The circles along the top of the chart represent a more stable reading of the overall trend. They require a greater degree of change in momentum to switch colors, making it easier to identify larger, more sustained trends. Red circles indicate a bearish trend, while green circles signify a bullish trend.
- Quicker Trend Change Circles (Bottom): The circles across the bottom of the chart are more responsive, designed to detect changes in momentum sooner. This means the circles change color more frequently, providing earlier signals of potential shifts in the market direction.
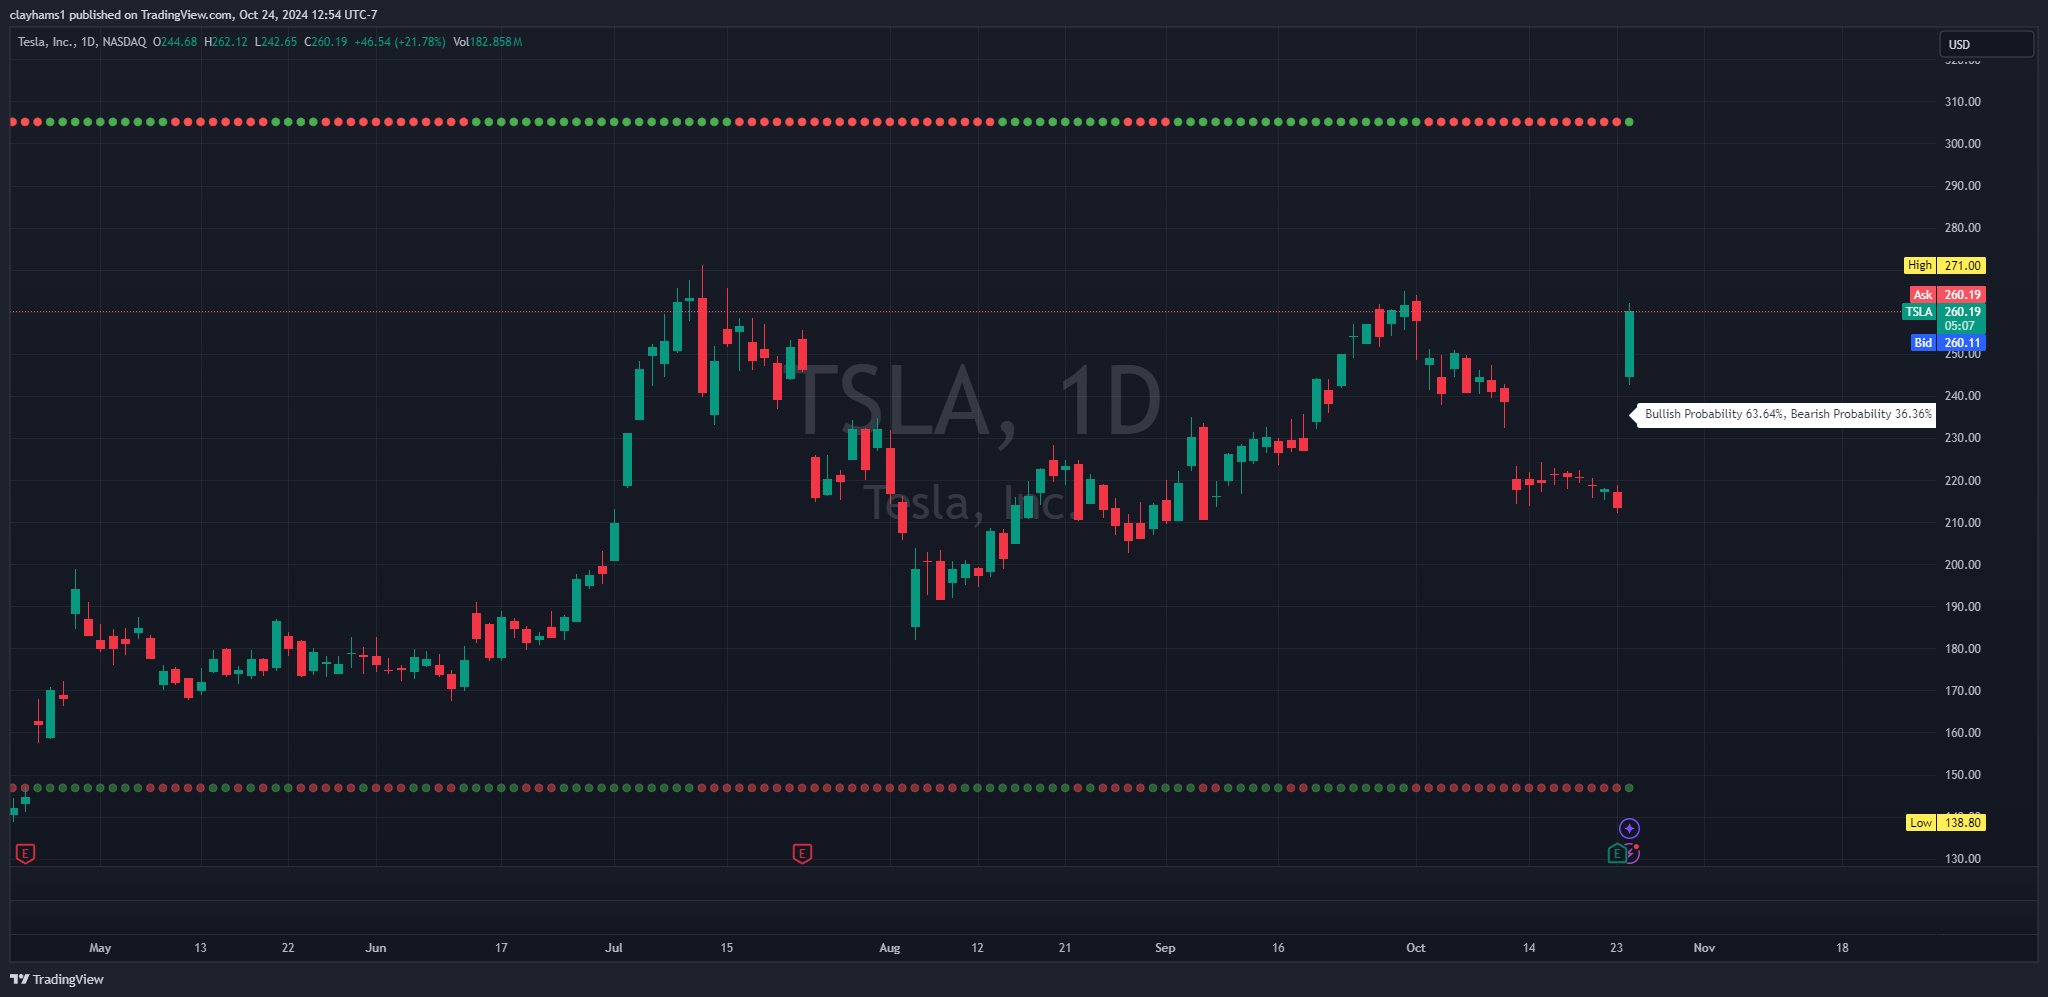
Overall Probability Reader
Hambone's Momentum Reader also includes an "Overall Probability Reader" that analyzes various EMAs to provide a percentage-based probability of bullish versus bearish conditions. The probability readings give traders a quick way to assess the likely market direction and can serve as an extra confirmation of the trend.
Probability Reader Example: The probability readings, such as "65% Bullish" and "35% Bearish," offer a data-driven insight into potential price movement, supporting informed trading decisions.
Adaptable for Every Market and Timeframe
Just like the other indicators in the Hamscalper Suite, Hambone's Momentum Reader works uniquely on each timeframe, ensuring that traders can use it effectively for scalping, day trading, or multi-day trend analysis. Whether you're trading Futures on the 6m, Crypto on the 1hr, Forex on the daily, or Stocks on the weekly, the Hambone Momentum Reader is designed to fit seamlessly into your strategy and provide valuable insights.
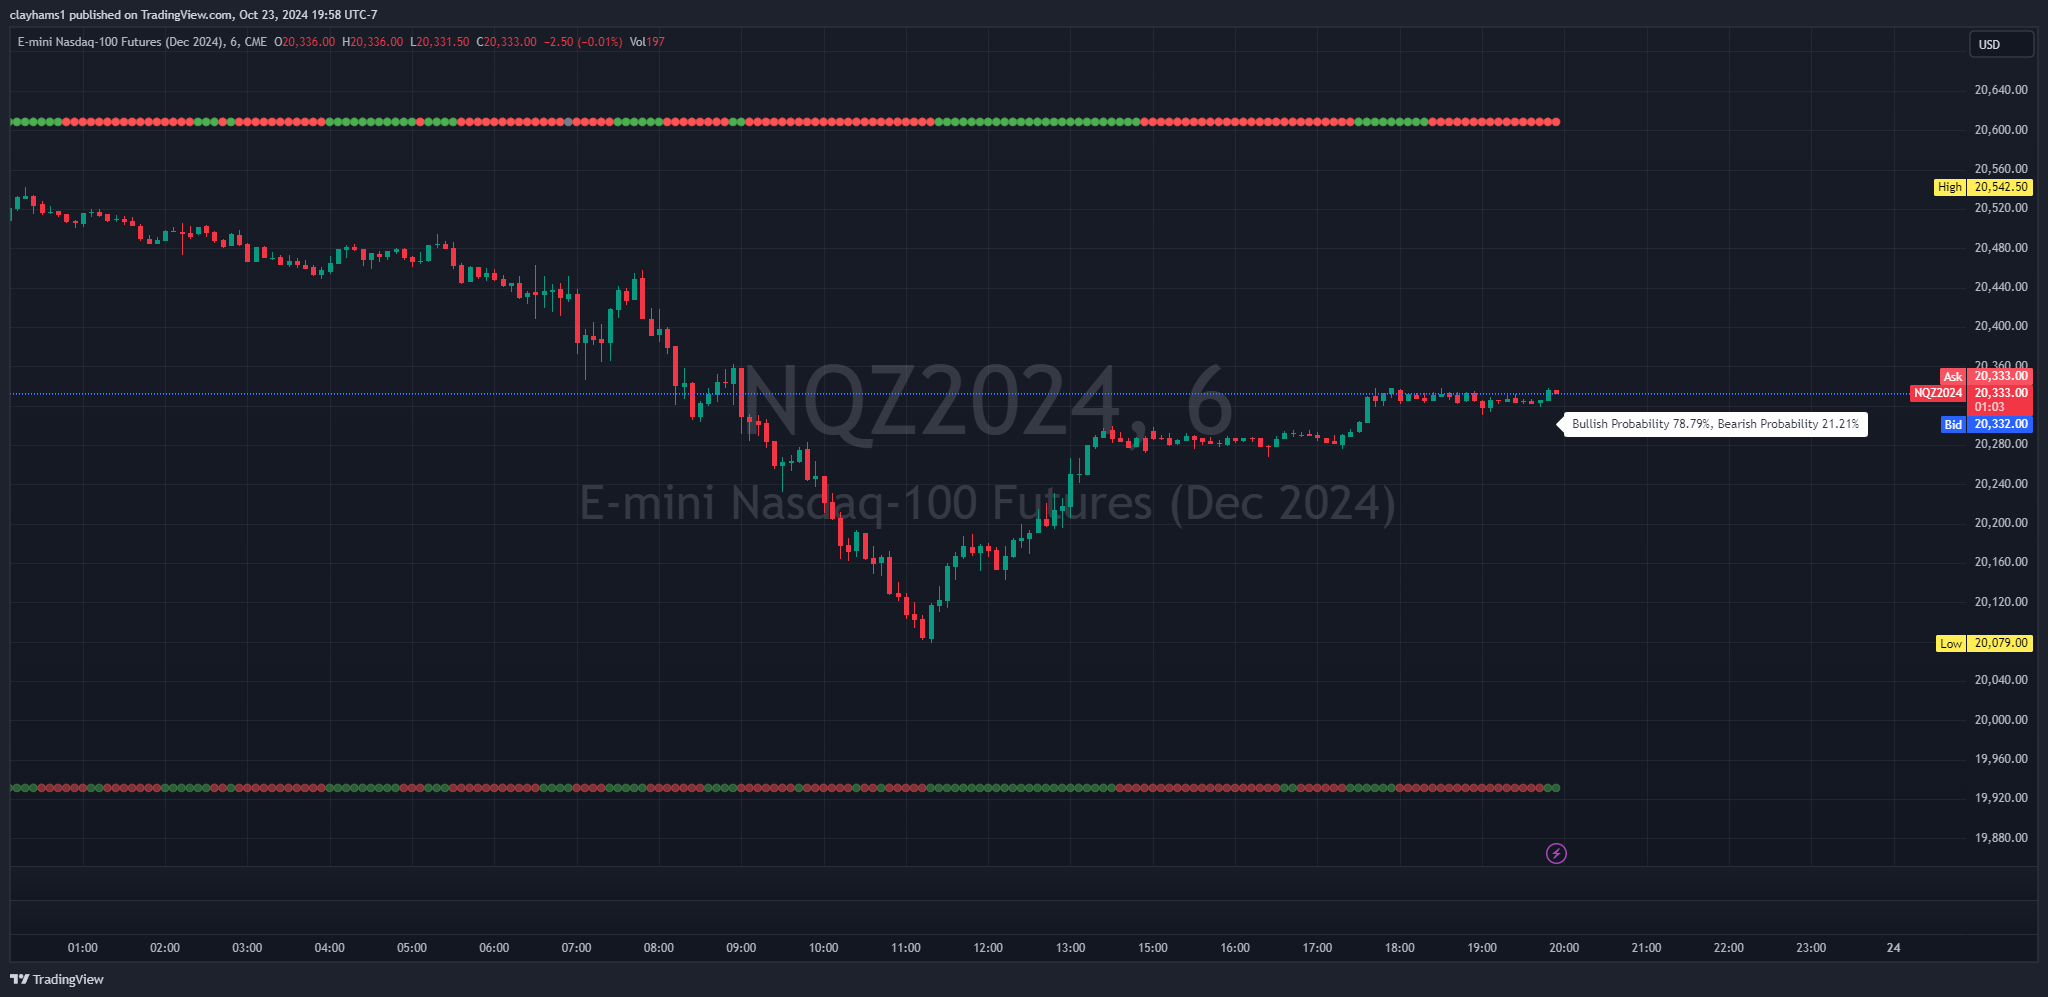
Scalping NQ on the 6M
Why Choose Hambone Momentum Reader?
- Comprehensive Trend Signals: Combines MACD and RSI to provide clear, visual signals of market momentum.
- Dual Trend Perspective: Locked-in circles for long-term trends and quicker circles for short-term momentum shifts.
- Integrated Probability Reader: Adds a layer of probability analysis to help confirm trend direction.
- Versatility Across All Markets and Timeframes: Suitable for all trading styles, from scalping to swing trading, across any market.
It's All about the Momentum!
Ready to automate your trading? Start with HamBot today and take your trading to the next level.
Disclaimer: All indicators and tools provided by Oink Opulence Endeavors LLC are for educational and informational purposes only. Trading involves significant risk of loss and is not suitable for all investors. None of the indicators or tools provided constitute financial advice, and no specific results are guaranteed. Oink Opulence Endeavors LLC carries zero responsibility for any losses incurred through the use of any of its indicators, tools, or strategies. Always conduct thorough research and consult a licensed financial professional before making any trading decisions. Use these tools at your own risk.
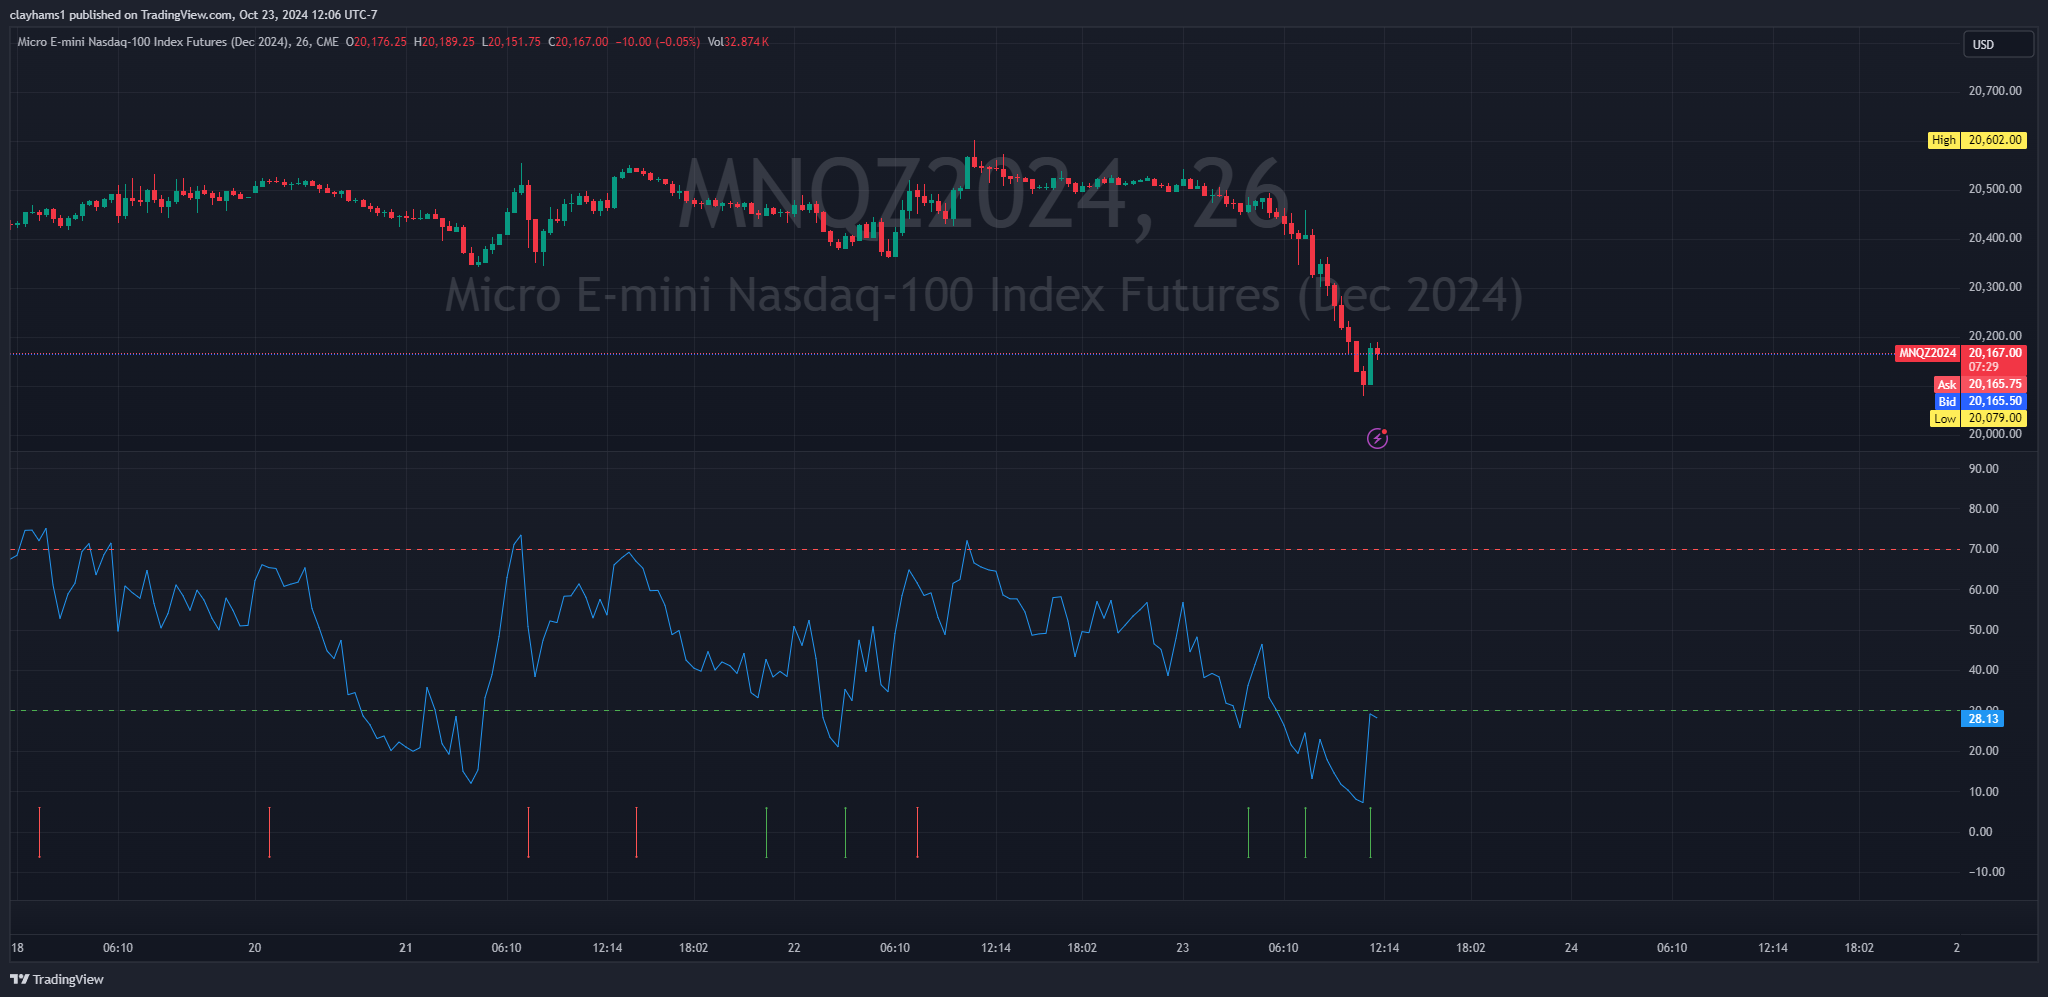
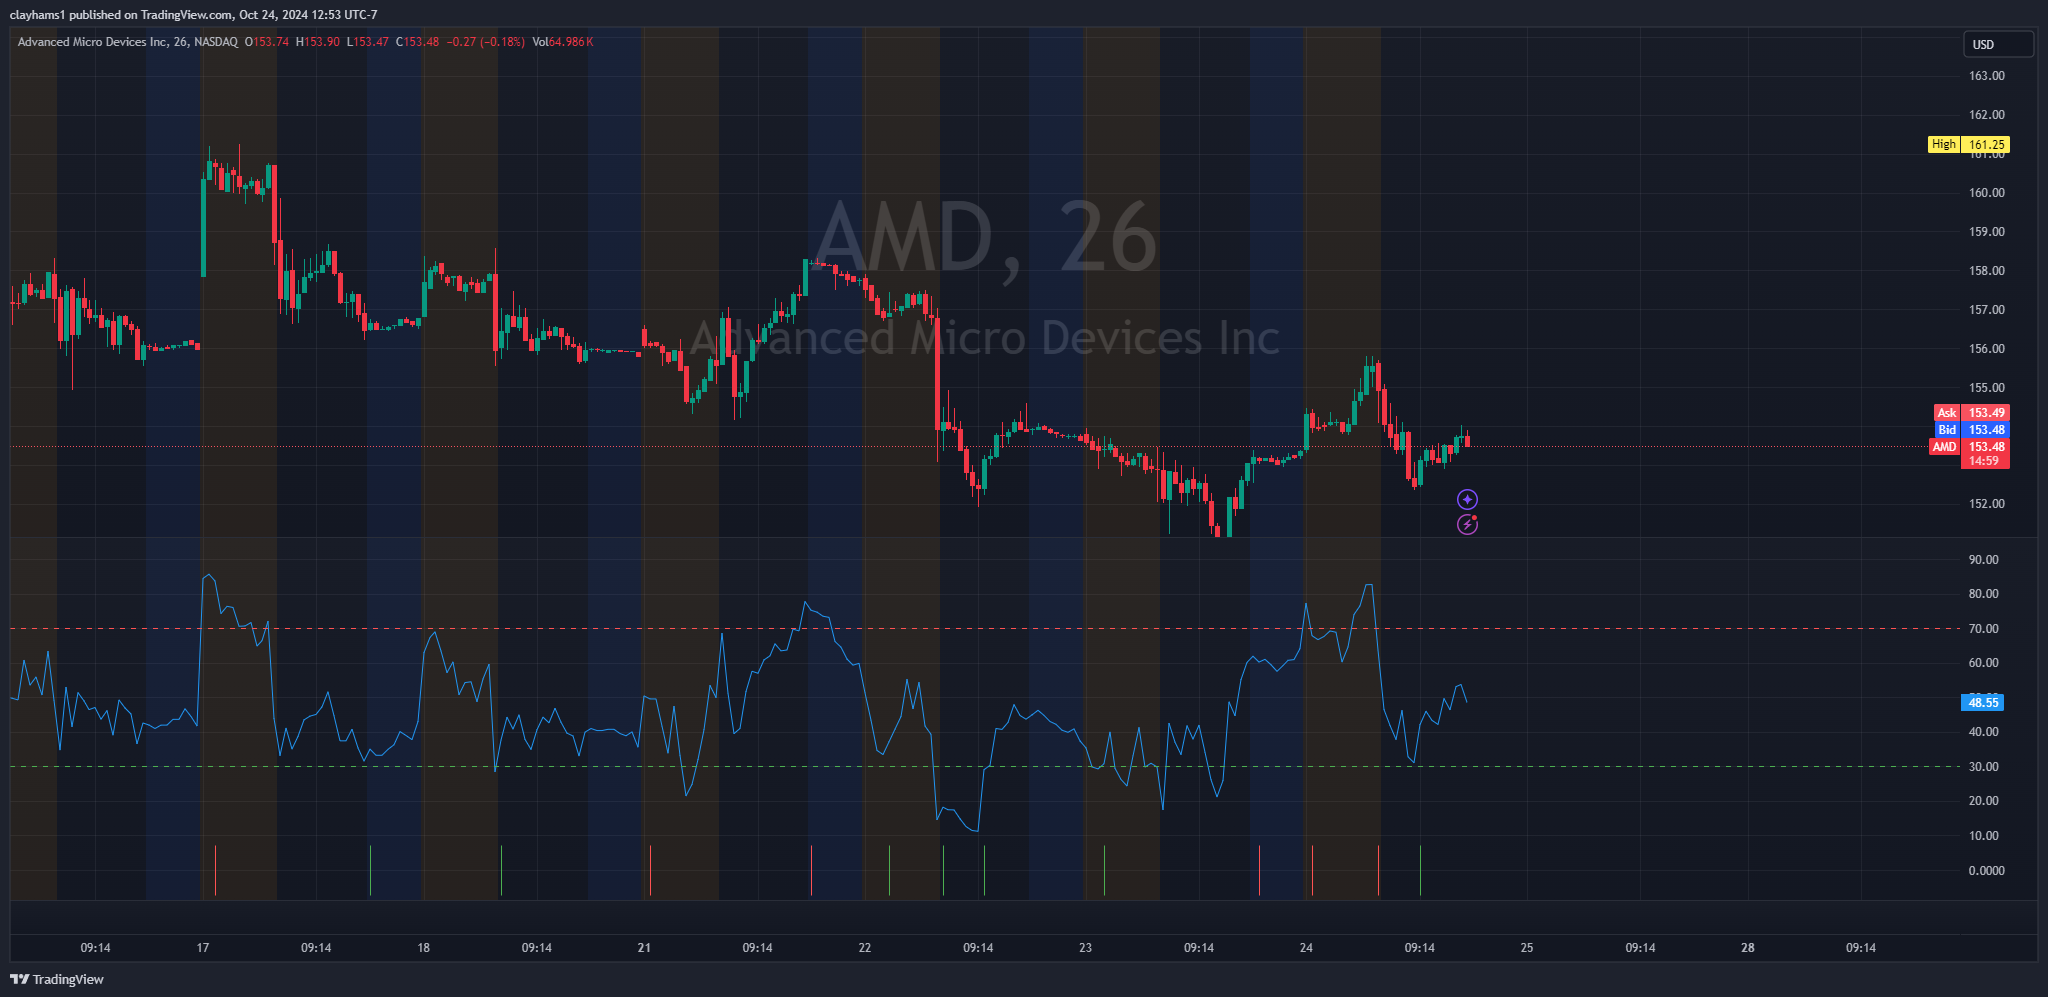
Hambone's RSI Divergence Detector: Spot Key Reversal Signals with Ease
Hambone's RSI Divergence Detector is a custom RSI-based tool crafted using my personal trading strategies to identify potential bullish and bearish divergences between RSI and price action. As part of the Hambone Suite of Indicators, this tool helps traders easily spot trend reversal signals, making it a valuable addition for any trading style, whether it's scalping, day trading, or swing trading.
Bullish and Bearish Divergences at a Glance
Hambone's RSI Divergence Detector provides clear, visual signals to indicate possible divergences:
- Bullish Divergence: A green arrow or line appears on the chart when the indicator detects a potential bullish divergence, signaling that a bearish trend may be weakening.
- Bearish Divergence: A red arrow or line appears when a potential bearish divergence is identified, suggesting that a bullish trend may be losing momentum.
Adaptable Across All Markets and Timeframes
Hambone's RSI Divergence Detector can be used on any market—Forex, Crypto, Stocks, or Futures—and on any timeframe. This flexibility allows traders to tailor it to their preferred trading style, whether they're executing quick scalps or focusing on longer-term trend reversals.
Why Hambone's RSI Divergence Detector?
- Powerful Reversal Detection: Identify key trend reversals using RSI divergences.
- Clear Visual Signals: Simple green and red arrows or lines make it easy to understand potential turning points.
- Seamless Integration: Use alongside the Hambone Suite for a complete trading toolkit.
Let's Find Your Next Divergence!
Ready to automate your trading? Start with HamBot today and take your trading to the next level.
Disclaimer: All indicators and tools provided by Oink Opulence Endeavors LLC are for educational and informational purposes only. Trading involves significant risk of loss and is not suitable for all investors. None of the indicators or tools provided constitute financial advice, and no specific results are guaranteed. Oink Opulence Endeavors LLC carries zero responsibility for any losses incurred through the use of any of its indicators, tools, or strategies. Always conduct thorough research and consult a licensed financial professional before making any trading decisions. Use these tools at your own risk.
Hambones Key Levels: Identify Critical Price Zones with Ease
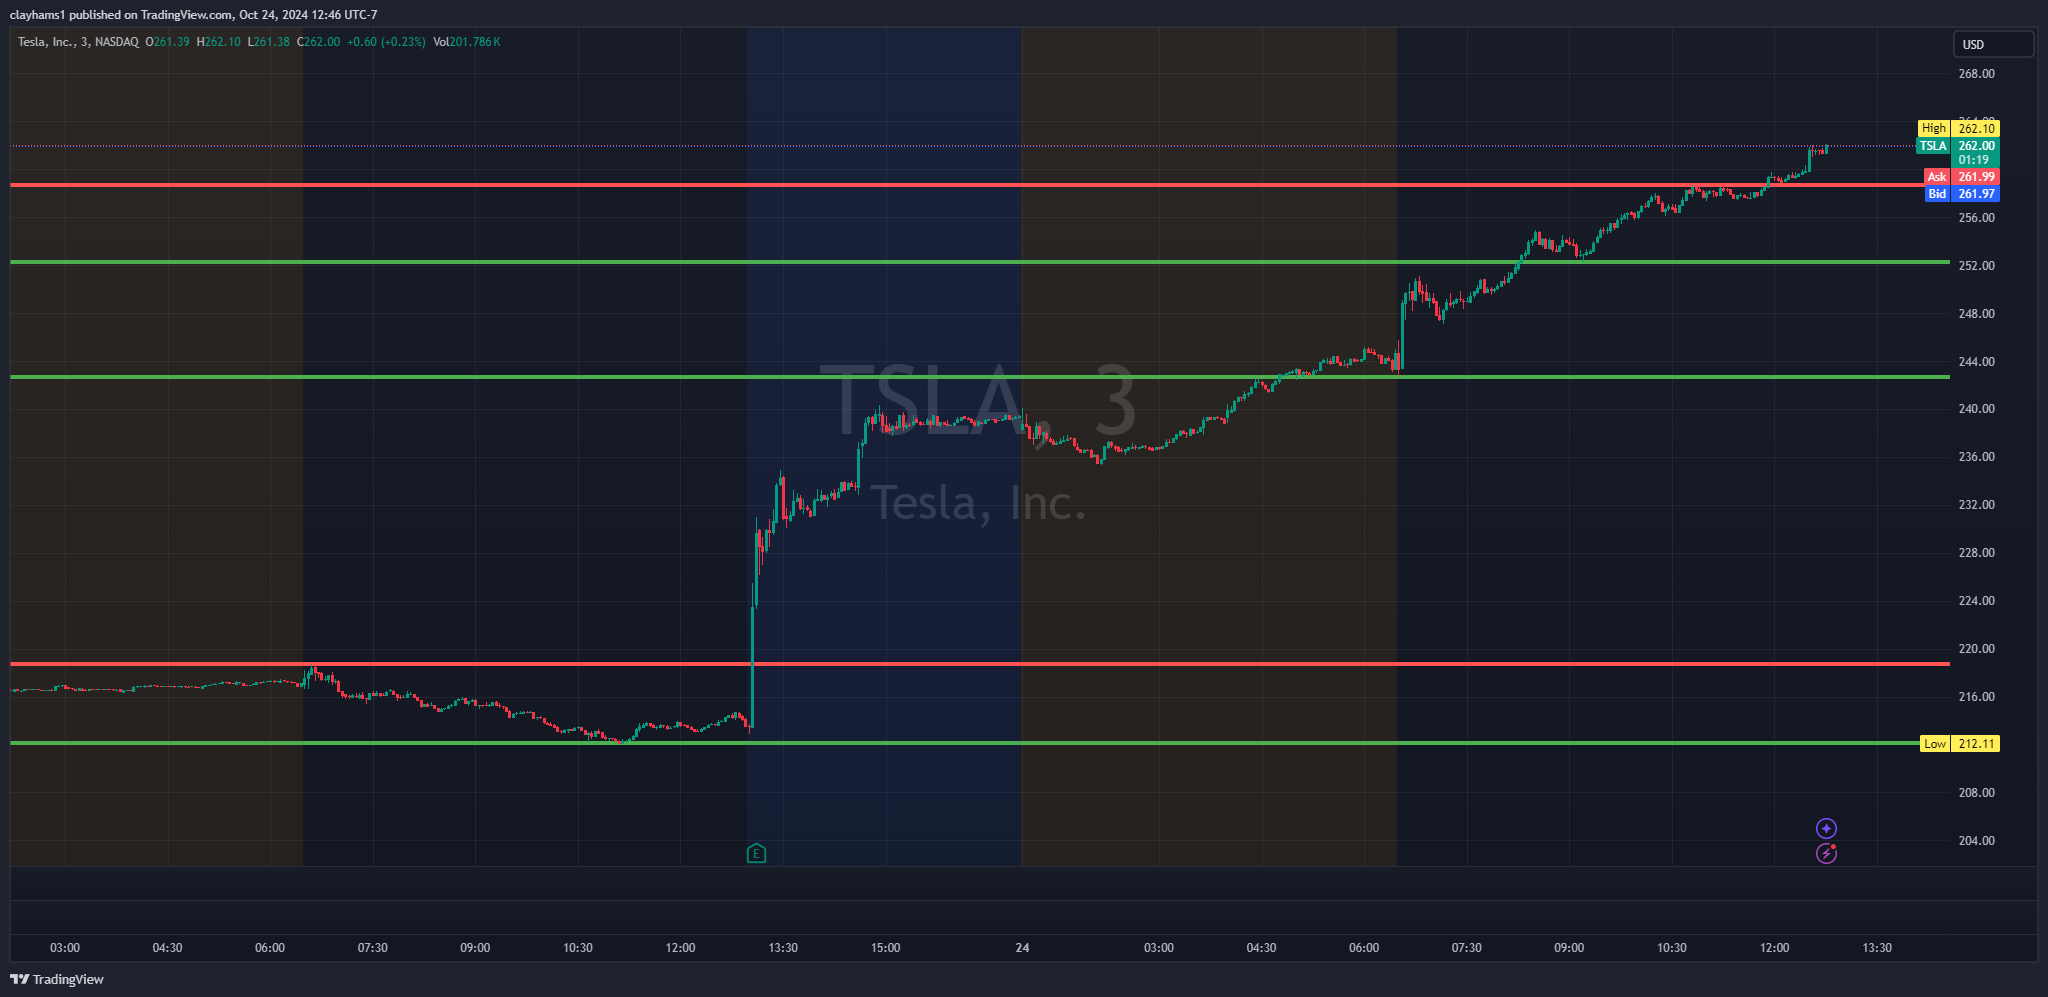
Hambones Key Levels is a dynamic support and resistance indicator designed to help traders automatically identify critical price levels on any ticker and timeframe. Whether you're trading Crypto, Forex, Stocks, or Futures, this tool can be tailored to potentially meet your needs, providing valuable insights for both short-term and long-term trading strategies. As part of the Hambone Suite of Indicators, Hambones Key Levels is included with every purchase.
Short Term and Long Term Key Levels
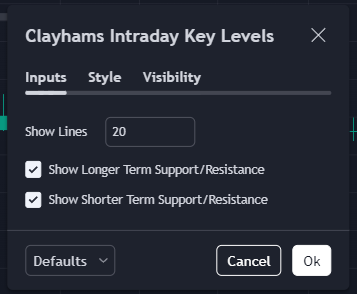
Hambones Key Levels offers two main settings to help traders fine-tune the support and resistance levels based on their trading style:
- Short Term Key Levels: Ideal for scalpers or short-term traders, these lines highlight potential price zones that are more reactive to recent market activity. You can turn these lines on or off depending on your preference.
- Long Term Key Levels: Designed for larger, more significant moves, the long-term key levels help identify price zones that could be critical over extended periods. These lines are more suited for those looking for multiple potential stronger support and resistance zones.

Customizable Key Level Generation
Hambones Key Levels allows users to select the number of lines generated, ranging from a few significant levels to up to 60 lines for comprehensive coverage. You can customize your settings based on the timeframe and style you're trading.
For instance, some traders may prefer generating only long-term key levels for the day, while others might utilize both short and long-term levels for a more granular view of potential support and resistance areas.
Recommended Usage
This indicator was originally designed to be used as part of my personal pre-market preparation. I typically set it to 16 or 20 long-term lines, prepare my chart for the day by adding red or green horizontal lines at the levels pre-generated by the indicator, and then turn the indicator off to reduce noise during trading hours.
After market close, Hambones Key Levels can be turned back on to verify or adjust lines for the next trading session, ensuring easy potential support and resistance levels to help be prepared for the next day.
Caution for Fast Market Moves
It's important to note that Hambones Key Levels can sometimes lag during sudden market movements, such as earnings announcements or significant economic events, especially if these occur outside of normal trading hours. The indicator may need time to catch up and re-calculate critical levels after such moves.
Why Choose Hambones Key Levels?
- Automatic Key Levels: Automatically plots critical support and resistance zones, saving you time during market preparation.
- Short and Long Term Flexibility: Use short-term levels for scalping or long-term levels for swing trading—both can be toggled on or off to suit your preferences.
- Customizable Line Generation: Set the number of key levels generated to fit your trading style, providing as much or as little detail as you need.
- Seamless Integration with Hambone Suite: Use Hambones Key Levels alongside other Hambone tools for a complete market analysis package.
Hambones Key Levels makes identifying key price levels effortless, helping traders make more informed decisions. Whether you're looking for support and resistance zones to scalp intraday or critical levels to hold through longer moves, this tool has you covered.
Don't forget your Key Levels!
Ready to automate your trading? Start with HamBot today and take your trading to the next level.
Disclaimer: All indicators and tools provided by Oink Opulence Endeavors LLC are for educational and informational purposes only. Trading involves significant risk of loss and is not suitable for all investors. None of the indicators or tools provided constitute financial advice, and no specific results are guaranteed. Oink Opulence Endeavors LLC carries zero responsibility for any losses incurred through the use of any of its indicators, tools, or strategies. Always conduct thorough research and consult a licensed financial professional before making any trading decisions. Use these tools at your own risk.
