Introduction
Welcome to the inaugural edition of the Market Insight Newsletter from Oink Opulence Endeavors. In these newsletters, we’ll provide expert analysis on market trends and key tickers, including AAPL, AMD, META, TSLA, and others. For our first issue, we’re spotlighting Apple Inc. (AAPL) and exploring a compelling bullish case based on technical analysis.
About the Author
I’m Clayhams1, a market analyst with over four years of experience sharing insights on X (@clayhams1). I’ve partnered with industry leaders like QuantData, Unusual Whales, TrendSpider, and TradingView, delivering data-driven analyses that explain the “why” behind market movements—not just the “what.” My custom TradingView indicators, such as the Long Term Trend Reader, identify critical support and resistance zones, trend shifts, and more, forming the backbone of our technical approach.
Technical Analysis: AAPL’s Bullish Setup
Our analysis hinges on the Long Term Trend Reader indicator, specifically the “Long Term Line,” which pinpoints reactive support and resistance levels over extended periods. We prioritize higher time frames—daily and weekly charts—for a robust view of AAPL’s price action.
Daily Chart Breakdown
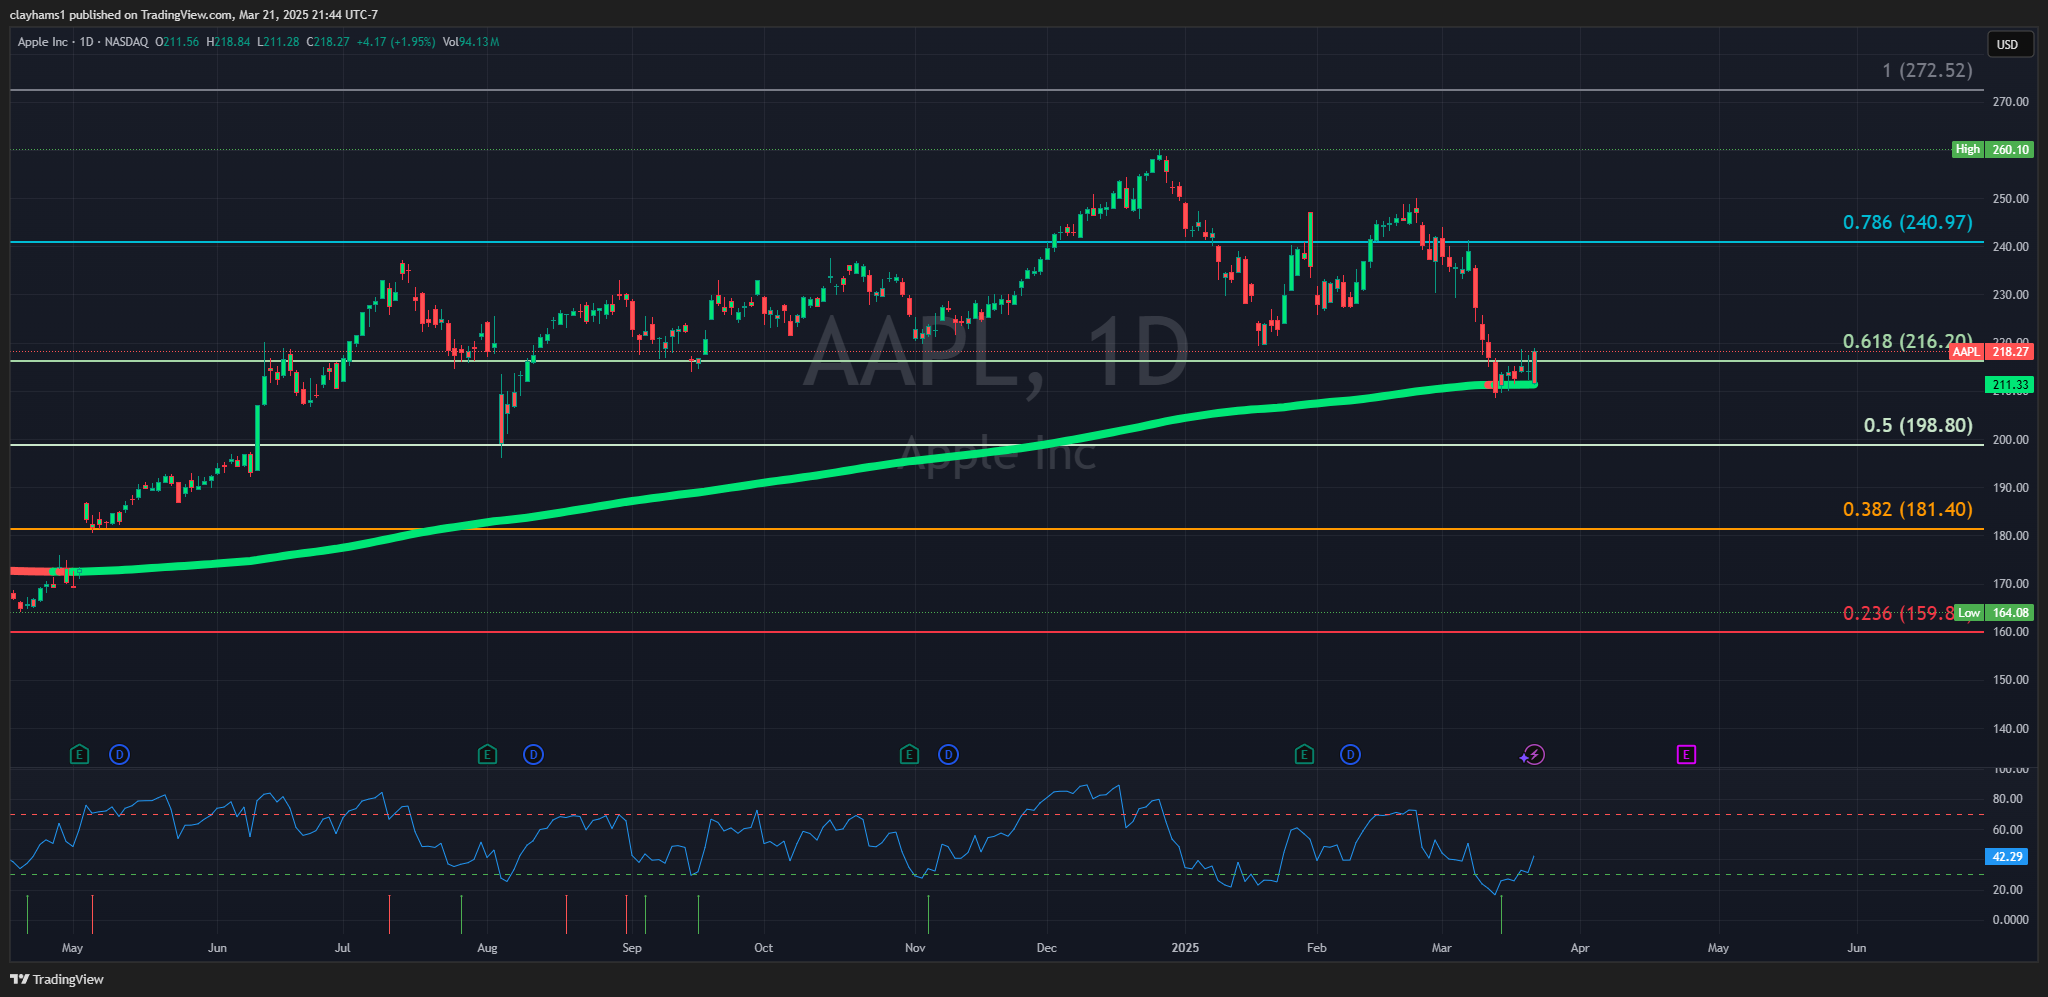
The Long Term Line on AAPL’s daily chart sits at approximately $211.33. This level was first retested on March 13, 2024, during a downtrend. Since then, AAPL has consistently held above it, with a significant bounce on March 21, 2024, closing at $218.27 (range: $211.28–$218.84). Historical data supports this as a launchpad for bullish moves:
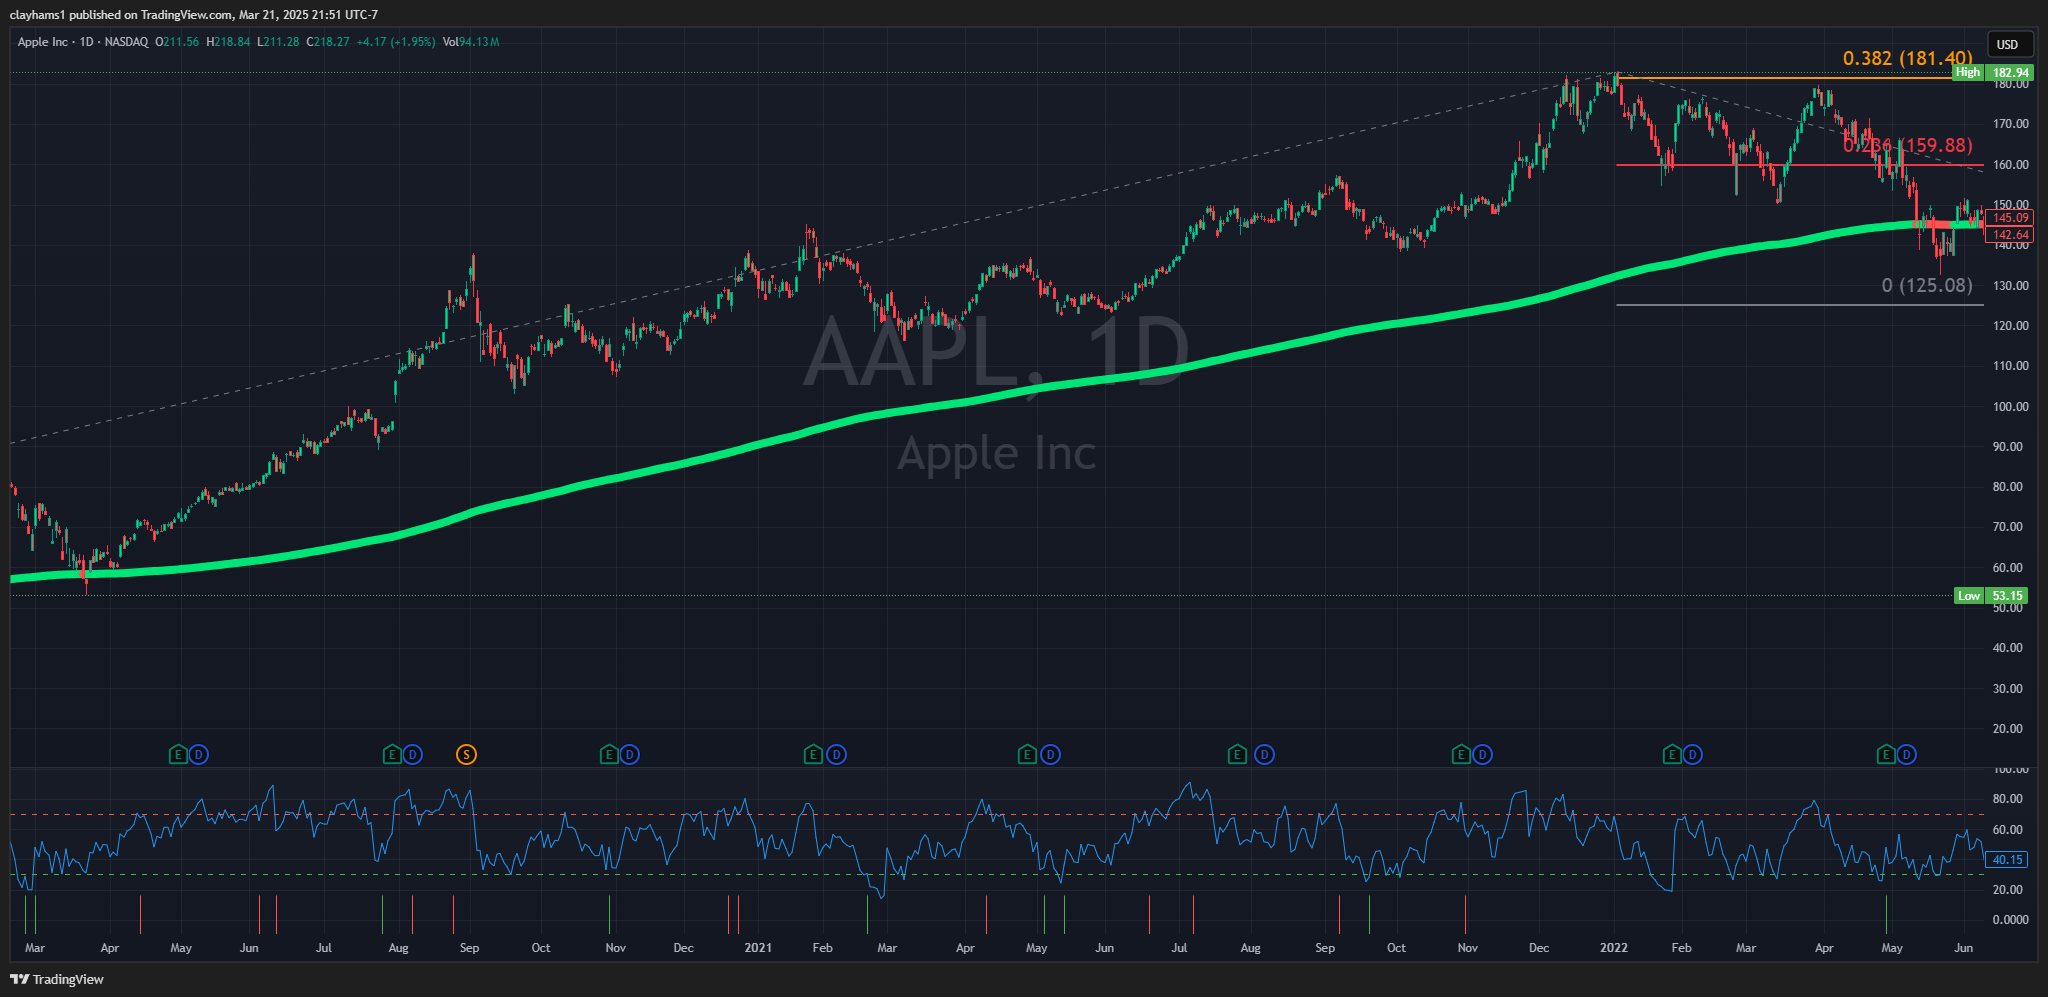
- July 14, 2022: A 20% rally post-retest before a downturn.
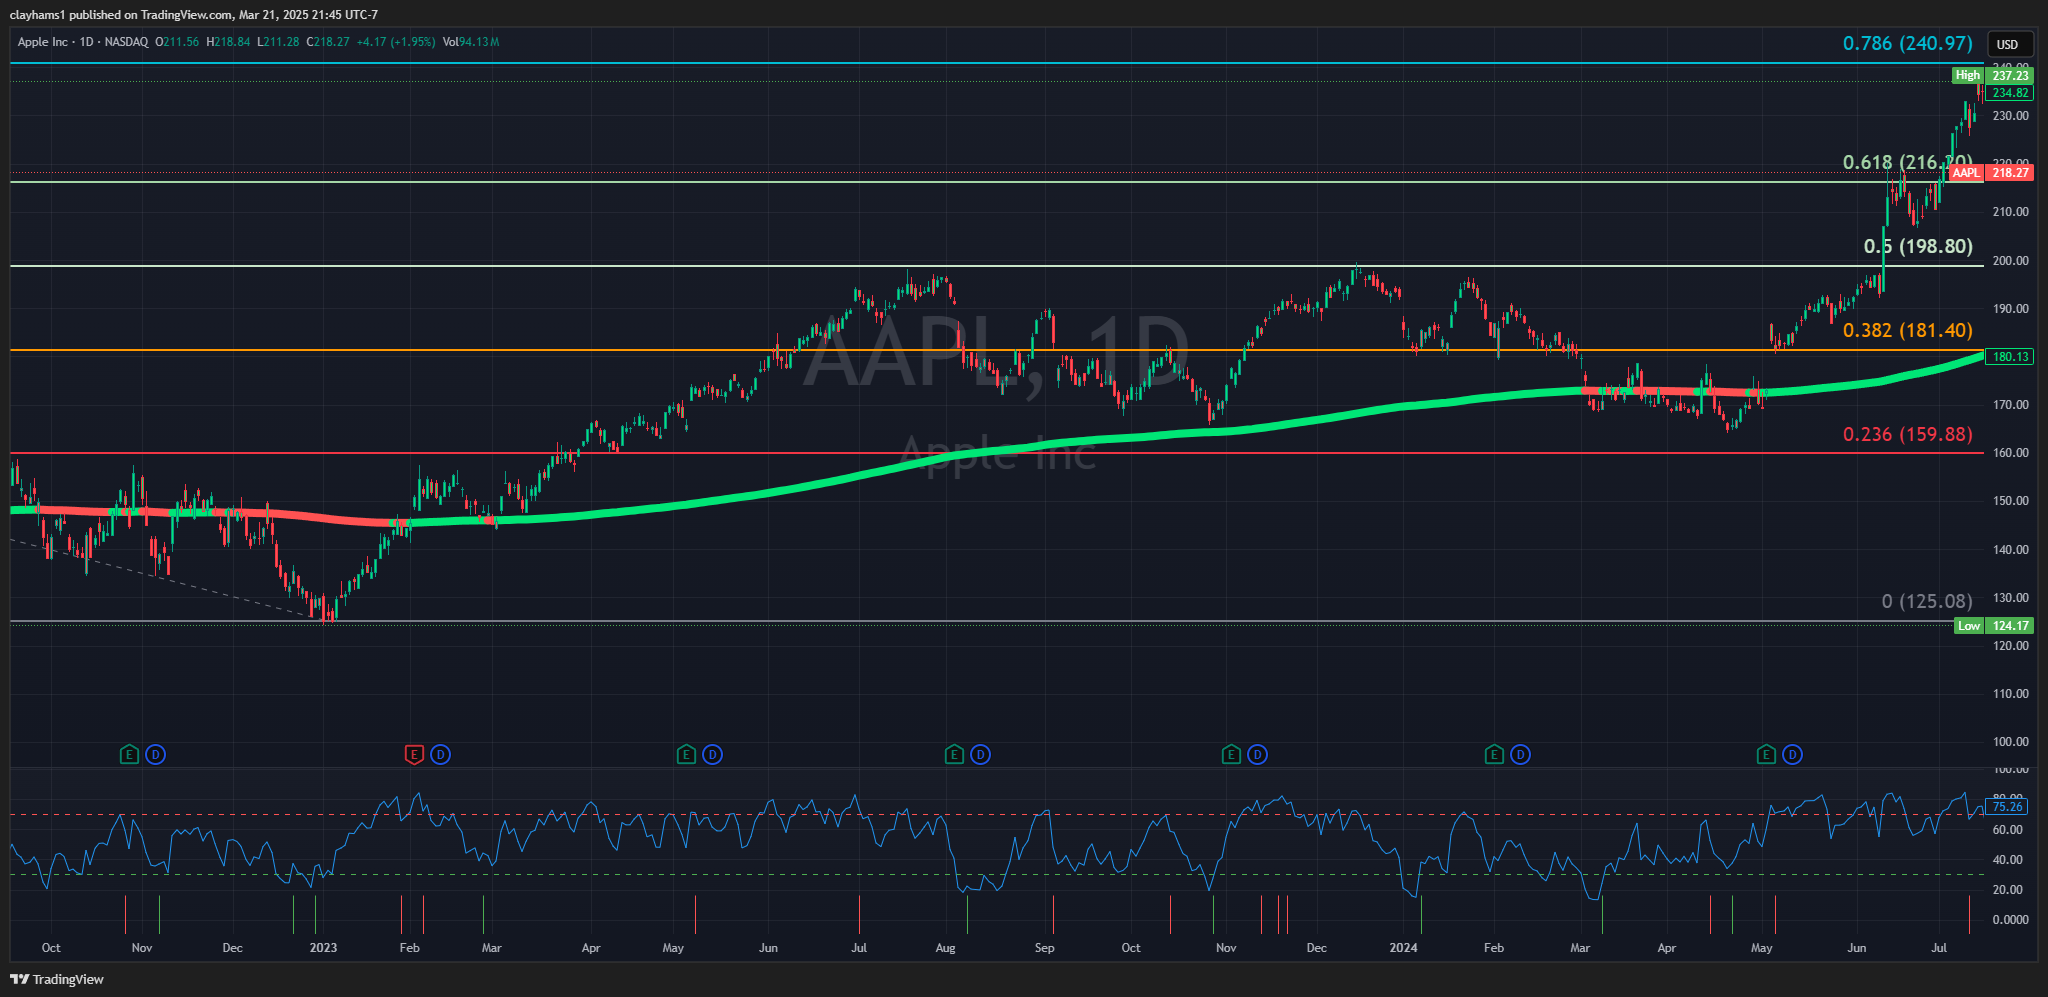
- March 12, 2023: A 35% surge before another decline.
Weekly Chart Context
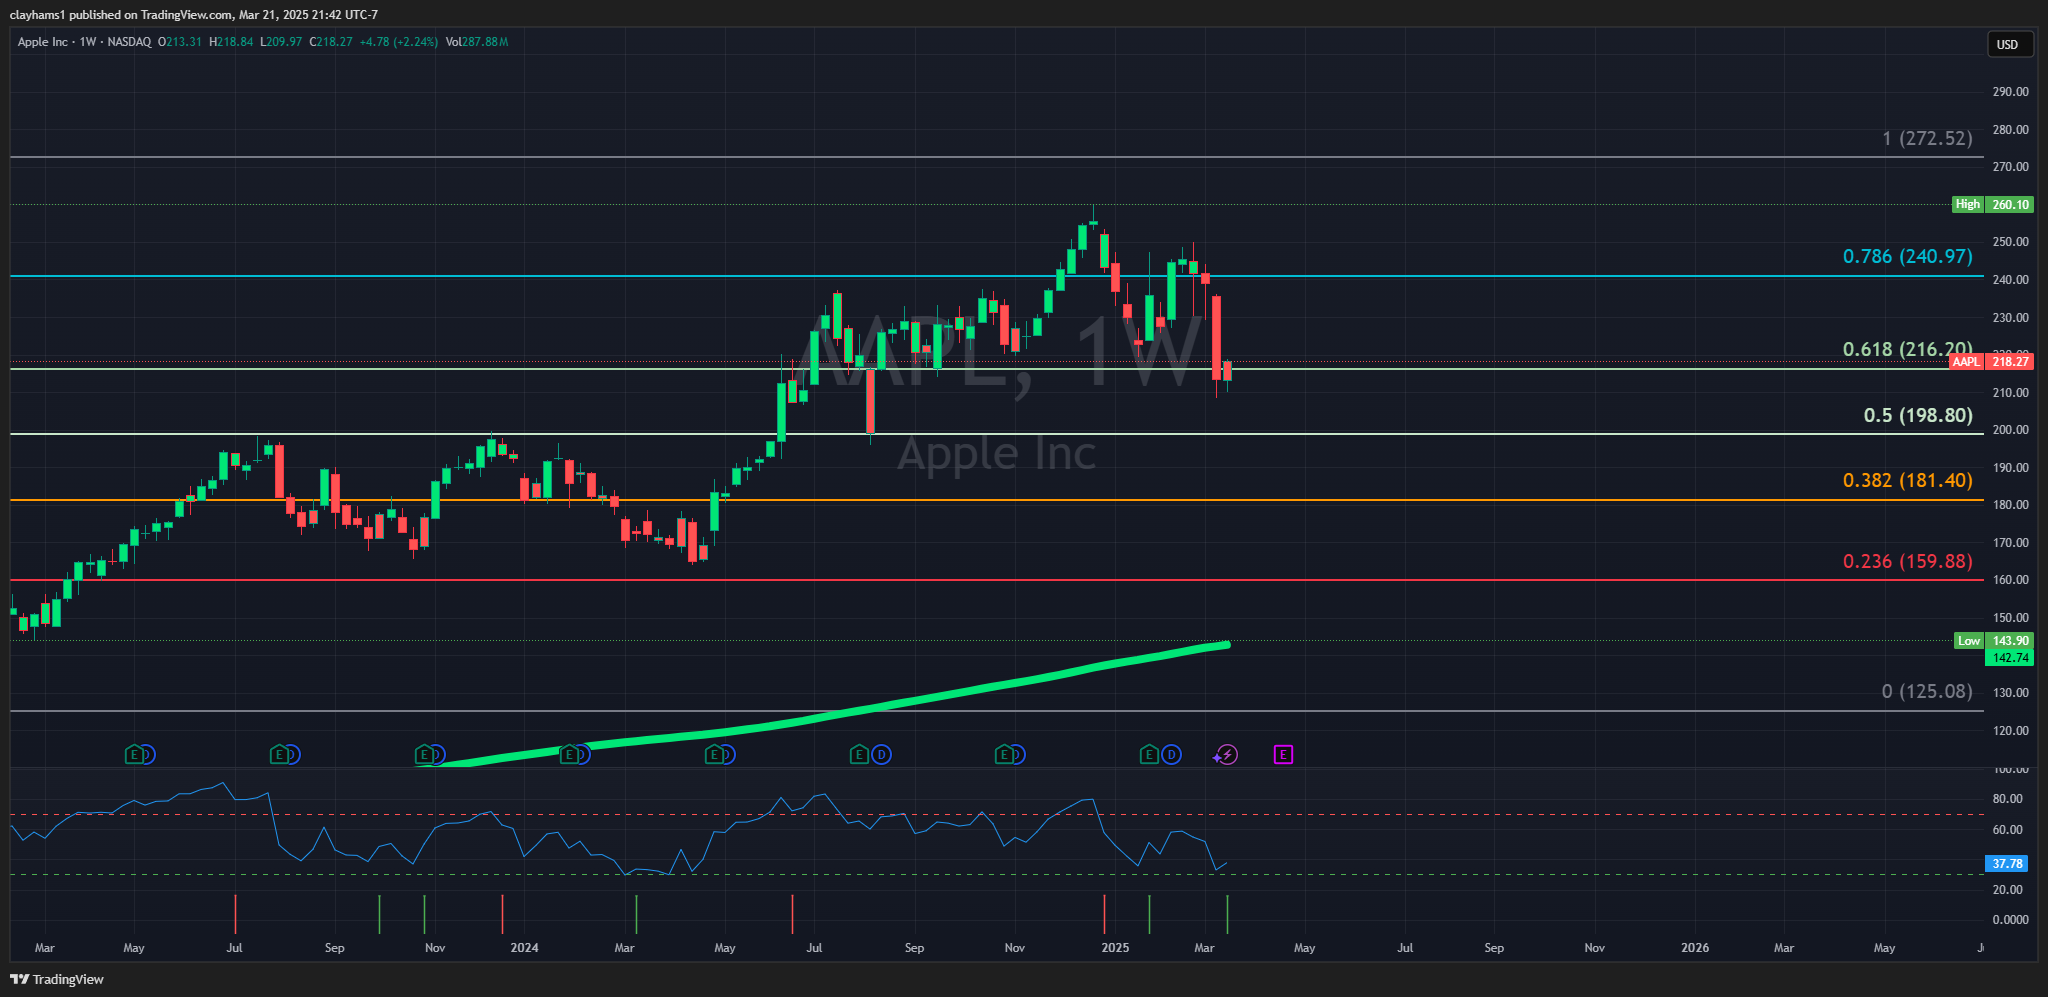
The weekly chart appears to have closed with an inside bar. Indicating potential indecisiviness around this level, However we can see it did close above the 0.618 Fib extension level at $216.20. Further indicating potential upside.
Volume Confirmation
On March 21, 2024, AAPL’s bounce coincided with a notable spike in volume compared to the prior week. This uptick strengthens the bullish case, as increased participation often signals conviction in historical support zones.
Potential Resistance Ahead
Should AAPL sustain its upward momentum, watch these resistance levels:
- $222.36
- $225.91
- $229.57
- $233.40
- $237.24
- 0.786 Fibonacci extension at $240.97
Past examples
Conclusion
While the market’s next move is never certain, AAPL’s current technical setup—bolstered by historical patterns and volume—suggests a bullish opportunity. We’ll keep tracking this ticker and share updates in future editions.
Written by Clayhams1
Oink Opulence Endeavors
Disclaimer
This newsletter is for informational purposes only and does not constitute financial advice. Trading and investing carry substantial risks, including the potential loss of principal. All opinions are those of the author and do not necessarily reflect the views of Oink Opulence Endeavors LLC or its affiliates. The author or Oink Opulence Endeavors LLC may hold positions in the securities mentioned. Readers are urged to perform their own due diligence and consult a licensed financial advisor before making investment decisions. Past performance is not a reliable indicator of future results. Oink Opulence Endeavors LLC disclaims any liability for losses resulting from actions taken based on this content.
